
Advanced Search: Build a Custom Dashboard

In the fields below, search for indicators by location, topics, population, classification, subgroup, or comparison. No fields are required, but we suggest selecting a location or two to start. In the additional search options section, select options to group and order search results. To learn more about how to customize a dashboard, see our help center.

Visit the Indicator List Page to see the full list of indicators and locations available on the site.

  • Map View
  • All Health Topics
  • All Community Topics
  • All Economy Topics
  • All Education Topics
  • All Environmental Health Topics
Search display options:

Search Results:

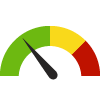
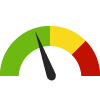
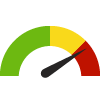
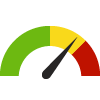
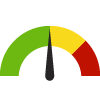
Indicator Gauge Icon Legend

Legend Colors

Red is bad, green is good, blue is not statistically different/neutral.

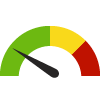
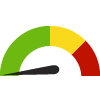
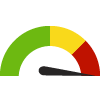
Compared to Distribution

an indicator guage with the arrow in the green 
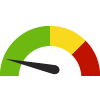
the value is in the best half of communities.

an indicator guage with the arrow in the yellow 
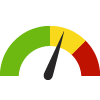
the value is in the 2nd worst quarter of communities.

an indicator guage with the arrow in the red 
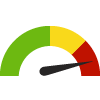
the value is in the worst quarter of communities.

Compared to Target

green circle with white tick inside it meets target; red circle with white cross inside it does not meet target.

Compared to a Single Value

green diamond with downward arrow inside it lower than the comparison value; red diamond with downward arrow inside it higher than the comparison value; blue diamond with downward arrow inside it not statistically different from comparison value.

Trend

green square outline with upward trending arrow inside it green square outline with downward trending arrow inside it non-significant change over time; green square with upward trending arrow inside it green square with downward trending arrow inside it significant change over time; blue square with equals sign no change over time.

Compared to Prior Value

green triangle with upward trending arrow inside it higher than the previous measurement period; green triangle with downward trending arrow inside it lower than the previous measurement period; blue equals sign no statistically different change  from previous measurement period.

More information about the gauges and icons

Health / Alcohol & Drug Use

Health / Alcohol & Drug Use

Health / Alcohol & Drug Use

Adults who Binge Drink

Value
Compared to:

Health / Alcohol & Drug Use

Adults who Binge Drink

Value
Compared to:

Adults who Binge Drink County: Monterey

Current Value:

Adults who Binge Drink County: Monterey

14.9%
(2021)
Compared to:
Compared to CA Counties, Monterey has a value of 14.9% which is in the best 50% of counties. Counties in the best 50% have a value lower than 15.3% while counties in the worst 25% have a value higher than 15.8%.
CA Counties
The distribution is based on data from 58 California counties.
Compared to U.S. Counties, Monterey has a value of 14.9% which is in the best 50% of counties. Counties in the best 50% have a value lower than 15.5% while counties in the worst 25% have a value higher than 17.0%.
U.S. Counties
The distribution is based on data from 3,074 U.S. counties and county equivalents.
Compared to the US Value (15.5%), Monterey has a value of 14.9% which is lower and better.
US Value
(15.5%)
The regional value is compared to the national value.

Adults who Binge Drink Census Place: Aromas

Current Value:

Adults who Binge Drink Census Place: Aromas

17.4%
(2021)
Compared to:
Compared to CA Census Places, Aromas has a value of 17.4% which is in the worst 25% of census places. Census places in the best 50% have a value lower than 15.8% while census places in the worst 25% have a value higher than 17.0%.
CA Census Places
The distribution is based on data from 1,472 locales.
Compared to U.S. Census Places, Aromas has a value of 17.4% which is in the 2nd worst quartile of census places. Census places in the best 50% have a value lower than 16.4% while census places in the worst 25% have a value higher than 18.2%.
U.S. Census Places
The distribution is based on data from 27,528 U.S. Census Places.
Compared to the Monterey, CA County Value (14.9%), Aromas has a value of 17.4% which is higher and worse.
Monterey, CA County Value
(14.9%)
The regional value is compared to the Monterey County value.
Compared to the US Value (15.5%), Aromas has a value of 17.4% which is higher and worse.
US Value
(15.5%)
The regional value is compared to the national value.

Adults who Binge Drink Census Place: Boronda

Current Value:

Adults who Binge Drink Census Place: Boronda

16.7%
(2021)
Compared to:
Compared to CA Census Places, Boronda has a value of 16.7% which is in the 2nd worst quartile of census places. Census places in the best 50% have a value lower than 15.8% while census places in the worst 25% have a value higher than 17.0%.
CA Census Places
The distribution is based on data from 1,472 locales.
Compared to U.S. Census Places, Boronda has a value of 16.7% which is in the 2nd worst quartile of census places. Census places in the best 50% have a value lower than 16.4% while census places in the worst 25% have a value higher than 18.2%.
U.S. Census Places
The distribution is based on data from 27,528 U.S. Census Places.
Compared to the Monterey, CA County Value (14.9%), Boronda has a value of 16.7% which is higher and worse.
Monterey, CA County Value
(14.9%)
The regional value is compared to the Monterey County value.
Compared to the US Value (15.5%), Boronda has a value of 16.7% which is higher and worse.
US Value
(15.5%)
The regional value is compared to the national value.

Adults who Binge Drink Census Place: Bradley

Current Value:

Adults who Binge Drink Census Place: Bradley

16.7%
(2021)
Compared to:
Compared to CA Census Places, Bradley has a value of 16.7% which is in the 2nd worst quartile of census places. Census places in the best 50% have a value lower than 15.8% while census places in the worst 25% have a value higher than 17.0%.
CA Census Places
The distribution is based on data from 1,472 locales.
Compared to U.S. Census Places, Bradley has a value of 16.7% which is in the 2nd worst quartile of census places. Census places in the best 50% have a value lower than 16.4% while census places in the worst 25% have a value higher than 18.2%.
U.S. Census Places
The distribution is based on data from 27,528 U.S. Census Places.
Compared to the Monterey, CA County Value (14.9%), Bradley has a value of 16.7% which is higher and worse.
Monterey, CA County Value
(14.9%)
The regional value is compared to the Monterey County value.
Compared to the US Value (15.5%), Bradley has a value of 16.7% which is higher and worse.
US Value
(15.5%)
The regional value is compared to the national value.

Adults who Binge Drink Census Place: Carmel Valley Village

Current Value:

Adults who Binge Drink Census Place: Carmel Valley Village

14.4%
(2021)
Compared to:
Compared to CA Census Places, Carmel Valley Village has a value of 14.4% which is in the best 50% of census places. Census places in the best 50% have a value lower than 15.8% while census places in the worst 25% have a value higher than 17.0%.
CA Census Places
The distribution is based on data from 1,472 locales.
Compared to U.S. Census Places, Carmel Valley Village has a value of 14.4% which is in the best 50% of census places. Census places in the best 50% have a value lower than 16.4% while census places in the worst 25% have a value higher than 18.2%.
U.S. Census Places
The distribution is based on data from 27,528 U.S. Census Places.
Compared to the Monterey, CA County Value (14.9%), Carmel Valley Village has a value of 14.4% which is lower and better.
Monterey, CA County Value
(14.9%)
The regional value is compared to the Monterey County value.
Compared to the US Value (15.5%), Carmel Valley Village has a value of 14.4% which is lower and better.
US Value
(15.5%)
The regional value is compared to the national value.

Adults who Binge Drink Census Place: Carmel-by-the-Sea

Current Value:

Adults who Binge Drink Census Place: Carmel-by-the-Sea

12.2%
(2021)
Compared to:
Compared to CA Census Places, Carmel-by-the-Sea has a value of 12.2% which is in the best 50% of census places. Census places in the best 50% have a value lower than 15.8% while census places in the worst 25% have a value higher than 17.0%.
CA Census Places
The distribution is based on data from 1,472 locales.
Compared to U.S. Census Places, Carmel-by-the-Sea has a value of 12.2% which is in the best 50% of census places. Census places in the best 50% have a value lower than 16.4% while census places in the worst 25% have a value higher than 18.2%.
U.S. Census Places
The distribution is based on data from 27,528 U.S. Census Places.
Compared to the Monterey, CA County Value (14.9%), Carmel-by-the-Sea has a value of 12.2% which is lower and better.
Monterey, CA County Value
(14.9%)
The regional value is compared to the Monterey County value.
Compared to the US Value (15.5%), Carmel-by-the-Sea has a value of 12.2% which is lower and better.
US Value
(15.5%)
The regional value is compared to the national value.

Adults who Binge Drink Census Place: Castroville

Current Value:

Adults who Binge Drink Census Place: Castroville

15.5%
(2021)
Compared to:
Compared to CA Census Places, Castroville has a value of 15.5% which is in the best 50% of census places. Census places in the best 50% have a value lower than 15.8% while census places in the worst 25% have a value higher than 17.0%.
CA Census Places
The distribution is based on data from 1,472 locales.
Compared to U.S. Census Places, Castroville has a value of 15.5% which is in the best 50% of census places. Census places in the best 50% have a value lower than 16.4% while census places in the worst 25% have a value higher than 18.2%.
U.S. Census Places
The distribution is based on data from 27,528 U.S. Census Places.
Compared to the Monterey, CA County Value (14.9%), Castroville has a value of 15.5% which is higher and worse.
Monterey, CA County Value
(14.9%)
The regional value is compared to the Monterey County value.
Compared to the US Value (15.5%), Castroville has a value of 15.5%.
US Value
(15.5%)
The regional value is compared to the national value.

Adults who Binge Drink Census Place: Chualar

Current Value:

Adults who Binge Drink Census Place: Chualar

16.6%
(2021)
Compared to:
Compared to CA Census Places, Chualar has a value of 16.6% which is in the 2nd worst quartile of census places. Census places in the best 50% have a value lower than 15.8% while census places in the worst 25% have a value higher than 17.0%.
CA Census Places
The distribution is based on data from 1,472 locales.
Compared to U.S. Census Places, Chualar has a value of 16.6% which is in the 2nd worst quartile of census places. Census places in the best 50% have a value lower than 16.4% while census places in the worst 25% have a value higher than 18.2%.
U.S. Census Places
The distribution is based on data from 27,528 U.S. Census Places.
Compared to the Monterey, CA County Value (14.9%), Chualar has a value of 16.6% which is higher and worse.
Monterey, CA County Value
(14.9%)
The regional value is compared to the Monterey County value.
Compared to the US Value (15.5%), Chualar has a value of 16.6% which is higher and worse.
US Value
(15.5%)
The regional value is compared to the national value.

Adults who Binge Drink Census Place: Del Monte Forest

Current Value:

Adults who Binge Drink Census Place: Del Monte Forest

11.5%
(2021)
Compared to:
Compared to CA Census Places, Del Monte Forest has a value of 11.5% which is in the best 50% of census places. Census places in the best 50% have a value lower than 15.8% while census places in the worst 25% have a value higher than 17.0%.
CA Census Places
The distribution is based on data from 1,472 locales.
Compared to U.S. Census Places, Del Monte Forest has a value of 11.5% which is in the best 50% of census places. Census places in the best 50% have a value lower than 16.4% while census places in the worst 25% have a value higher than 18.2%.
U.S. Census Places
The distribution is based on data from 27,528 U.S. Census Places.
Compared to the Monterey, CA County Value (14.9%), Del Monte Forest has a value of 11.5% which is lower and better.
Monterey, CA County Value
(14.9%)
The regional value is compared to the Monterey County value.
Compared to the US Value (15.5%), Del Monte Forest has a value of 11.5% which is lower and better.
US Value
(15.5%)
The regional value is compared to the national value.

Adults who Binge Drink Census Place: Del Rey Oaks

Current Value:

Adults who Binge Drink Census Place: Del Rey Oaks

15.6%
(2021)
Compared to:
Compared to CA Census Places, Del Rey Oaks has a value of 15.6% which is in the best 50% of census places. Census places in the best 50% have a value lower than 15.8% while census places in the worst 25% have a value higher than 17.0%.
CA Census Places
The distribution is based on data from 1,472 locales.
Compared to U.S. Census Places, Del Rey Oaks has a value of 15.6% which is in the best 50% of census places. Census places in the best 50% have a value lower than 16.4% while census places in the worst 25% have a value higher than 18.2%.
U.S. Census Places
The distribution is based on data from 27,528 U.S. Census Places.
Compared to the Monterey, CA County Value (14.9%), Del Rey Oaks has a value of 15.6% which is higher and worse.
Monterey, CA County Value
(14.9%)
The regional value is compared to the Monterey County value.
Compared to the US Value (15.5%), Del Rey Oaks has a value of 15.6% which is higher and worse.
US Value
(15.5%)
The regional value is compared to the national value.

Adults who Binge Drink Census Place: Elkhorn

Current Value:

Adults who Binge Drink Census Place: Elkhorn

16.2%
(2021)
Compared to:
Compared to CA Census Places, Elkhorn has a value of 16.2% which is in the 2nd worst quartile of census places. Census places in the best 50% have a value lower than 15.8% while census places in the worst 25% have a value higher than 17.0%.
CA Census Places
The distribution is based on data from 1,472 locales.
Compared to U.S. Census Places, Elkhorn has a value of 16.2% which is in the best 50% of census places. Census places in the best 50% have a value lower than 16.4% while census places in the worst 25% have a value higher than 18.2%.
U.S. Census Places
The distribution is based on data from 27,528 U.S. Census Places.
Compared to the Monterey, CA County Value (14.9%), Elkhorn has a value of 16.2% which is higher and worse.
Monterey, CA County Value
(14.9%)
The regional value is compared to the Monterey County value.
Compared to the US Value (15.5%), Elkhorn has a value of 16.2% which is higher and worse.
US Value
(15.5%)
The regional value is compared to the national value.

Adults who Binge Drink Census Place: Gonzales

Current Value:

Adults who Binge Drink Census Place: Gonzales

16.2%
(2021)
Compared to:
Compared to CA Census Places, Gonzales has a value of 16.2% which is in the 2nd worst quartile of census places. Census places in the best 50% have a value lower than 15.8% while census places in the worst 25% have a value higher than 17.0%.
CA Census Places
The distribution is based on data from 1,472 locales.
Compared to U.S. Census Places, Gonzales has a value of 16.2% which is in the best 50% of census places. Census places in the best 50% have a value lower than 16.4% while census places in the worst 25% have a value higher than 18.2%.
U.S. Census Places
The distribution is based on data from 27,528 U.S. Census Places.
Compared to the Monterey, CA County Value (14.9%), Gonzales has a value of 16.2% which is higher and worse.
Monterey, CA County Value
(14.9%)
The regional value is compared to the Monterey County value.
Compared to the US Value (15.5%), Gonzales has a value of 16.2% which is higher and worse.
US Value
(15.5%)
The regional value is compared to the national value.

Adults who Binge Drink Census Place: Greenfield

Current Value:

Adults who Binge Drink Census Place: Greenfield

16.6%
(2021)
Compared to:
Compared to CA Census Places, Greenfield has a value of 16.6% which is in the 2nd worst quartile of census places. Census places in the best 50% have a value lower than 15.8% while census places in the worst 25% have a value higher than 17.0%.
CA Census Places
The distribution is based on data from 1,472 locales.
Compared to U.S. Census Places, Greenfield has a value of 16.6% which is in the 2nd worst quartile of census places. Census places in the best 50% have a value lower than 16.4% while census places in the worst 25% have a value higher than 18.2%.
U.S. Census Places
The distribution is based on data from 27,528 U.S. Census Places.
Compared to the Monterey, CA County Value (14.9%), Greenfield has a value of 16.6% which is higher and worse.
Monterey, CA County Value
(14.9%)
The regional value is compared to the Monterey County value.
Compared to the US Value (15.5%), Greenfield has a value of 16.6% which is higher and worse.
US Value
(15.5%)
The regional value is compared to the national value.

Adults who Binge Drink Census Place: King City

Current Value:

Adults who Binge Drink Census Place: King City

15.9%
(2021)
Compared to:
Compared to CA Census Places, King City has a value of 15.9% which is in the 2nd worst quartile of census places. Census places in the best 50% have a value lower than 15.8% while census places in the worst 25% have a value higher than 17.0%.
CA Census Places
The distribution is based on data from 1,472 locales.
Compared to U.S. Census Places, King City has a value of 15.9% which is in the best 50% of census places. Census places in the best 50% have a value lower than 16.4% while census places in the worst 25% have a value higher than 18.2%.
U.S. Census Places
The distribution is based on data from 27,528 U.S. Census Places.
Compared to the Monterey, CA County Value (14.9%), King City has a value of 15.9% which is higher and worse.
Monterey, CA County Value
(14.9%)
The regional value is compared to the Monterey County value.
Compared to the US Value (15.5%), King City has a value of 15.9% which is higher and worse.
US Value
(15.5%)
The regional value is compared to the national value.

Adults who Binge Drink Census Place: Las Lomas

Current Value:

Adults who Binge Drink Census Place: Las Lomas

17.4%
(2021)
Compared to:
Compared to CA Census Places, Las Lomas has a value of 17.4% which is in the worst 25% of census places. Census places in the best 50% have a value lower than 15.8% while census places in the worst 25% have a value higher than 17.0%.
CA Census Places
The distribution is based on data from 1,472 locales.
Compared to U.S. Census Places, Las Lomas has a value of 17.4% which is in the 2nd worst quartile of census places. Census places in the best 50% have a value lower than 16.4% while census places in the worst 25% have a value higher than 18.2%.
U.S. Census Places
The distribution is based on data from 27,528 U.S. Census Places.
Compared to the Monterey, CA County Value (14.9%), Las Lomas has a value of 17.4% which is higher and worse.
Monterey, CA County Value
(14.9%)
The regional value is compared to the Monterey County value.
Compared to the US Value (15.5%), Las Lomas has a value of 17.4% which is higher and worse.
US Value
(15.5%)
The regional value is compared to the national value.

Adults who Binge Drink Census Place: Lockwood

Current Value:

Adults who Binge Drink Census Place: Lockwood

14.9%
(2021)
Compared to:
Compared to CA Census Places, Lockwood has a value of 14.9% which is in the best 50% of census places. Census places in the best 50% have a value lower than 15.8% while census places in the worst 25% have a value higher than 17.0%.
CA Census Places
The distribution is based on data from 1,472 locales.
Compared to U.S. Census Places, Lockwood has a value of 14.9% which is in the best 50% of census places. Census places in the best 50% have a value lower than 16.4% while census places in the worst 25% have a value higher than 18.2%.
U.S. Census Places
The distribution is based on data from 27,528 U.S. Census Places.
Compared to the Monterey, CA County Value (14.9%), Lockwood has a value of 14.9%.
Monterey, CA County Value
(14.9%)
The regional value is compared to the Monterey County value.
Compared to the US Value (15.5%), Lockwood has a value of 14.9% which is lower and better.
US Value
(15.5%)
The regional value is compared to the national value.

Adults who Binge Drink Census Place: Marina

Current Value:

Adults who Binge Drink Census Place: Marina

14.9%
(2021)
Compared to:
Compared to CA Census Places, Marina has a value of 14.9% which is in the best 50% of census places. Census places in the best 50% have a value lower than 15.8% while census places in the worst 25% have a value higher than 17.0%.
CA Census Places
The distribution is based on data from 1,472 locales.
Compared to U.S. Census Places, Marina has a value of 14.9% which is in the best 50% of census places. Census places in the best 50% have a value lower than 16.4% while census places in the worst 25% have a value higher than 18.2%.
U.S. Census Places
The distribution is based on data from 27,528 U.S. Census Places.
Compared to the Monterey, CA County Value (14.9%), Marina has a value of 14.9%.
Monterey, CA County Value
(14.9%)
The regional value is compared to the Monterey County value.
Compared to the US Value (15.5%), Marina has a value of 14.9% which is lower and better.
US Value
(15.5%)
The regional value is compared to the national value.

Adults who Binge Drink Census Place: Monterey

Current Value:

Adults who Binge Drink Census Place: Monterey

17.4%
(2021)
Compared to:
Compared to CA Census Places, Monterey has a value of 17.4% which is in the worst 25% of census places. Census places in the best 50% have a value lower than 15.8% while census places in the worst 25% have a value higher than 17.0%.
CA Census Places
The distribution is based on data from 1,472 locales.
Compared to U.S. Census Places, Monterey has a value of 17.4% which is in the 2nd worst quartile of census places. Census places in the best 50% have a value lower than 16.4% while census places in the worst 25% have a value higher than 18.2%.
U.S. Census Places
The distribution is based on data from 27,528 U.S. Census Places.
Compared to the Monterey, CA County Value (14.9%), Monterey has a value of 17.4% which is higher and worse.
Monterey, CA County Value
(14.9%)
The regional value is compared to the Monterey County value.
Compared to the US Value (15.5%), Monterey has a value of 17.4% which is higher and worse.
US Value
(15.5%)
The regional value is compared to the national value.

Adults who Binge Drink Census Place: Moss Landing

Current Value:

Adults who Binge Drink Census Place: Moss Landing

16.0%
(2021)
Compared to:
Compared to CA Census Places, Moss Landing has a value of 16.0% which is in the 2nd worst quartile of census places. Census places in the best 50% have a value lower than 15.8% while census places in the worst 25% have a value higher than 17.0%.
CA Census Places
The distribution is based on data from 1,472 locales.
Compared to U.S. Census Places, Moss Landing has a value of 16.0% which is in the best 50% of census places. Census places in the best 50% have a value lower than 16.4% while census places in the worst 25% have a value higher than 18.2%.
U.S. Census Places
The distribution is based on data from 27,528 U.S. Census Places.
Compared to the Monterey, CA County Value (14.9%), Moss Landing has a value of 16.0% which is higher and worse.
Monterey, CA County Value
(14.9%)
The regional value is compared to the Monterey County value.
Compared to the US Value (15.5%), Moss Landing has a value of 16.0% which is higher and worse.
US Value
(15.5%)
The regional value is compared to the national value.

Adults who Binge Drink Census Place: Pacific Grove

Current Value:

Adults who Binge Drink Census Place: Pacific Grove

14.8%
(2021)
Compared to:
Compared to CA Census Places, Pacific Grove has a value of 14.8% which is in the best 50% of census places. Census places in the best 50% have a value lower than 15.8% while census places in the worst 25% have a value higher than 17.0%.
CA Census Places
The distribution is based on data from 1,472 locales.
Compared to U.S. Census Places, Pacific Grove has a value of 14.8% which is in the best 50% of census places. Census places in the best 50% have a value lower than 16.4% while census places in the worst 25% have a value higher than 18.2%.
U.S. Census Places
The distribution is based on data from 27,528 U.S. Census Places.
Compared to the Monterey, CA County Value (14.9%), Pacific Grove has a value of 14.8% which is lower and better.
Monterey, CA County Value
(14.9%)
The regional value is compared to the Monterey County value.
Compared to the US Value (15.5%), Pacific Grove has a value of 14.8% which is lower and better.
US Value
(15.5%)
The regional value is compared to the national value.

Adults who Binge Drink Census Place: Pajaro

Current Value:

Adults who Binge Drink Census Place: Pajaro

15.8%
(2021)
Compared to:
Compared to CA Census Places, Pajaro has a value of 15.8% which is in the best 50% of census places. Census places in the best 50% have a value lower than 15.8% while census places in the worst 25% have a value higher than 17.0%.
CA Census Places
The distribution is based on data from 1,472 locales.
Compared to U.S. Census Places, Pajaro has a value of 15.8% which is in the best 50% of census places. Census places in the best 50% have a value lower than 16.4% while census places in the worst 25% have a value higher than 18.2%.
U.S. Census Places
The distribution is based on data from 27,528 U.S. Census Places.
Compared to the Monterey, CA County Value (14.9%), Pajaro has a value of 15.8% which is higher and worse.
Monterey, CA County Value
(14.9%)
The regional value is compared to the Monterey County value.
Compared to the US Value (15.5%), Pajaro has a value of 15.8% which is higher and worse.
US Value
(15.5%)
The regional value is compared to the national value.

Adults who Binge Drink Census Place: Pine Canyon

Current Value:

Adults who Binge Drink Census Place: Pine Canyon

15.5%
(2021)
Compared to:
Compared to CA Census Places, Pine Canyon has a value of 15.5% which is in the best 50% of census places. Census places in the best 50% have a value lower than 15.8% while census places in the worst 25% have a value higher than 17.0%.
CA Census Places
The distribution is based on data from 1,472 locales.
Compared to U.S. Census Places, Pine Canyon has a value of 15.5% which is in the best 50% of census places. Census places in the best 50% have a value lower than 16.4% while census places in the worst 25% have a value higher than 18.2%.
U.S. Census Places
The distribution is based on data from 27,528 U.S. Census Places.
Compared to the Monterey, CA County Value (14.9%), Pine Canyon has a value of 15.5% which is higher and worse.
Monterey, CA County Value
(14.9%)
The regional value is compared to the Monterey County value.
Compared to the US Value (15.5%), Pine Canyon has a value of 15.5%.
US Value
(15.5%)
The regional value is compared to the national value.

Adults who Binge Drink Census Place: Prunedale

Current Value:

Adults who Binge Drink Census Place: Prunedale

15.9%
(2021)
Compared to:
Compared to CA Census Places, Prunedale has a value of 15.9% which is in the 2nd worst quartile of census places. Census places in the best 50% have a value lower than 15.8% while census places in the worst 25% have a value higher than 17.0%.
CA Census Places
The distribution is based on data from 1,472 locales.
Compared to U.S. Census Places, Prunedale has a value of 15.9% which is in the best 50% of census places. Census places in the best 50% have a value lower than 16.4% while census places in the worst 25% have a value higher than 18.2%.
U.S. Census Places
The distribution is based on data from 27,528 U.S. Census Places.
Compared to the Monterey, CA County Value (14.9%), Prunedale has a value of 15.9% which is higher and worse.
Monterey, CA County Value
(14.9%)
The regional value is compared to the Monterey County value.
Compared to the US Value (15.5%), Prunedale has a value of 15.9% which is higher and worse.
US Value
(15.5%)
The regional value is compared to the national value.

Adults who Binge Drink Census Place: Salinas

Current Value:

Adults who Binge Drink Census Place: Salinas

15.5%
(2021)
Compared to:
Compared to CA Census Places, Salinas has a value of 15.5% which is in the best 50% of census places. Census places in the best 50% have a value lower than 15.8% while census places in the worst 25% have a value higher than 17.0%.
CA Census Places
The distribution is based on data from 1,472 locales.
Compared to U.S. Census Places, Salinas has a value of 15.5% which is in the best 50% of census places. Census places in the best 50% have a value lower than 16.4% while census places in the worst 25% have a value higher than 18.2%.
U.S. Census Places
The distribution is based on data from 27,528 U.S. Census Places.
Compared to the Monterey, CA County Value (14.9%), Salinas has a value of 15.5% which is higher and worse.
Monterey, CA County Value
(14.9%)
The regional value is compared to the Monterey County value.
Compared to the US Value (15.5%), Salinas has a value of 15.5%.
US Value
(15.5%)
The regional value is compared to the national value.

Adults who Binge Drink Census Place: San Ardo

Current Value:

Adults who Binge Drink Census Place: San Ardo

17.0%
(2021)
Compared to:
Compared to CA Census Places, San Ardo has a value of 17.0% which is in the worst 25% of census places. Census places in the best 50% have a value lower than 15.8% while census places in the worst 25% have a value higher than 17.0%.
CA Census Places
The distribution is based on data from 1,472 locales.
Compared to U.S. Census Places, San Ardo has a value of 17.0% which is in the 2nd worst quartile of census places. Census places in the best 50% have a value lower than 16.4% while census places in the worst 25% have a value higher than 18.2%.
U.S. Census Places
The distribution is based on data from 27,528 U.S. Census Places.
Compared to the Monterey, CA County Value (14.9%), San Ardo has a value of 17.0% which is higher and worse.
Monterey, CA County Value
(14.9%)
The regional value is compared to the Monterey County value.
Compared to the US Value (15.5%), San Ardo has a value of 17.0% which is higher and worse.
US Value
(15.5%)
The regional value is compared to the national value.

Adults who Binge Drink Census Place: San Lucas

Current Value:

Adults who Binge Drink Census Place: San Lucas

15.4%
(2021)
Compared to:
Compared to CA Census Places, San Lucas has a value of 15.4% which is in the best 50% of census places. Census places in the best 50% have a value lower than 15.8% while census places in the worst 25% have a value higher than 17.0%.
CA Census Places
The distribution is based on data from 1,472 locales.
Compared to U.S. Census Places, San Lucas has a value of 15.4% which is in the best 50% of census places. Census places in the best 50% have a value lower than 16.4% while census places in the worst 25% have a value higher than 18.2%.
U.S. Census Places
The distribution is based on data from 27,528 U.S. Census Places.
Compared to the Monterey, CA County Value (14.9%), San Lucas has a value of 15.4% which is higher and worse.
Monterey, CA County Value
(14.9%)
The regional value is compared to the Monterey County value.
Compared to the US Value (15.5%), San Lucas has a value of 15.4% which is lower and better.
US Value
(15.5%)
The regional value is compared to the national value.

Adults who Binge Drink Census Place: Sand City

Current Value:

Adults who Binge Drink Census Place: Sand City

18.1%
(2021)
Compared to:
Compared to CA Census Places, Sand City has a value of 18.1% which is in the worst 25% of census places. Census places in the best 50% have a value lower than 15.8% while census places in the worst 25% have a value higher than 17.0%.
CA Census Places
The distribution is based on data from 1,472 locales.
Compared to U.S. Census Places, Sand City has a value of 18.1% which is in the 2nd worst quartile of census places. Census places in the best 50% have a value lower than 16.4% while census places in the worst 25% have a value higher than 18.2%.
U.S. Census Places
The distribution is based on data from 27,528 U.S. Census Places.
Compared to the Monterey, CA County Value (14.9%), Sand City has a value of 18.1% which is higher and worse.
Monterey, CA County Value
(14.9%)
The regional value is compared to the Monterey County value.
Compared to the US Value (15.5%), Sand City has a value of 18.1% which is higher and worse.
US Value
(15.5%)
The regional value is compared to the national value.

Adults who Binge Drink Census Place: Seaside

Current Value:

Adults who Binge Drink Census Place: Seaside

16.4%
(2021)
Compared to:
Compared to CA Census Places, Seaside has a value of 16.4% which is in the 2nd worst quartile of census places. Census places in the best 50% have a value lower than 15.8% while census places in the worst 25% have a value higher than 17.0%.
CA Census Places
The distribution is based on data from 1,472 locales.
Compared to U.S. Census Places, Seaside has a value of 16.4% which is in the best 50% of census places. Census places in the best 50% have a value lower than 16.4% while census places in the worst 25% have a value higher than 18.2%.
U.S. Census Places
The distribution is based on data from 27,528 U.S. Census Places.
Compared to the Monterey, CA County Value (14.9%), Seaside has a value of 16.4% which is higher and worse.
Monterey, CA County Value
(14.9%)
The regional value is compared to the Monterey County value.
Compared to the US Value (15.5%), Seaside has a value of 16.4% which is higher and worse.
US Value
(15.5%)
The regional value is compared to the national value.

Adults who Binge Drink Census Place: Soledad

Current Value:

Adults who Binge Drink Census Place: Soledad

19.2%
(2021)
Compared to:
Compared to CA Census Places, Soledad has a value of 19.2% which is in the worst 25% of census places. Census places in the best 50% have a value lower than 15.8% while census places in the worst 25% have a value higher than 17.0%.
CA Census Places
The distribution is based on data from 1,472 locales.
Compared to U.S. Census Places, Soledad has a value of 19.2% which is in the worst 25% of census places. Census places in the best 50% have a value lower than 16.4% while census places in the worst 25% have a value higher than 18.2%.
U.S. Census Places
The distribution is based on data from 27,528 U.S. Census Places.
Compared to the Monterey, CA County Value (14.9%), Soledad has a value of 19.2% which is higher and worse.
Monterey, CA County Value
(14.9%)
The regional value is compared to the Monterey County value.
Compared to the US Value (15.5%), Soledad has a value of 19.2% which is higher and worse.
US Value
(15.5%)
The regional value is compared to the national value.

Adults who Binge Drink Census Place: Spreckels

Current Value:

Adults who Binge Drink Census Place: Spreckels

15.5%
(2021)
Compared to:
Compared to CA Census Places, Spreckels has a value of 15.5% which is in the best 50% of census places. Census places in the best 50% have a value lower than 15.8% while census places in the worst 25% have a value higher than 17.0%.
CA Census Places
The distribution is based on data from 1,472 locales.
Compared to U.S. Census Places, Spreckels has a value of 15.5% which is in the best 50% of census places. Census places in the best 50% have a value lower than 16.4% while census places in the worst 25% have a value higher than 18.2%.
U.S. Census Places
The distribution is based on data from 27,528 U.S. Census Places.
Compared to the Monterey, CA County Value (14.9%), Spreckels has a value of 15.5% which is higher and worse.
Monterey, CA County Value
(14.9%)
The regional value is compared to the Monterey County value.
Compared to the US Value (15.5%), Spreckels has a value of 15.5%.
US Value
(15.5%)
The regional value is compared to the national value.

Adults who Binge Drink Zip Code: 93426

Current Value:

Adults who Binge Drink Zip Code: 93426

16.4%
(2021)
Compared to:
Compared to CA Zip Codes, 93426 has a value of 16.4% which is in the 2nd worst quartile of zip codes. Zip codes in the best 50% have a value lower than 15.9% while zip codes in the worst 25% have a value higher than 17.1%.
CA Zip Codes
The distribution is based on data from 1,730 California zip codes.
Compared to U.S. Zip Codes, 93426 has a value of 16.4% which is in the best 50% of zip codes. Zip codes in the best 50% have a value lower than 16.5% while zip codes in the worst 25% have a value higher than 18.1%.
U.S. Zip Codes
The distribution is based on data from 31,435 U.S. zip codes.
Compared to the Monterey, CA County Value (14.9%), 93426 has a value of 16.4% which is higher and worse.
Monterey, CA County Value
(14.9%)
The regional value is compared to the Monterey County value.
Compared to the US Value (15.5%), 93426 has a value of 16.4% which is higher and worse.
US Value
(15.5%)
The regional value is compared to the national value.

Adults who Binge Drink Zip Code: 93450

Current Value:

Adults who Binge Drink Zip Code: 93450

17.0%
(2021)
Compared to:
Compared to CA Zip Codes, 93450 has a value of 17.0% which is in the 2nd worst quartile of zip codes. Zip codes in the best 50% have a value lower than 15.9% while zip codes in the worst 25% have a value higher than 17.1%.
CA Zip Codes
The distribution is based on data from 1,730 California zip codes.
Compared to U.S. Zip Codes, 93450 has a value of 17.0% which is in the 2nd worst quartile of zip codes. Zip codes in the best 50% have a value lower than 16.5% while zip codes in the worst 25% have a value higher than 18.1%.
U.S. Zip Codes
The distribution is based on data from 31,435 U.S. zip codes.
Compared to the Monterey, CA County Value (14.9%), 93450 has a value of 17.0% which is higher and worse.
Monterey, CA County Value
(14.9%)
The regional value is compared to the Monterey County value.
Compared to the US Value (15.5%), 93450 has a value of 17.0% which is higher and worse.
US Value
(15.5%)
The regional value is compared to the national value.

Adults who Binge Drink Zip Code: 93901

Current Value:

Adults who Binge Drink Zip Code: 93901

15.1%
(2021)
Compared to:
Compared to CA Zip Codes, 93901 has a value of 15.1% which is in the best 50% of zip codes. Zip codes in the best 50% have a value lower than 15.9% while zip codes in the worst 25% have a value higher than 17.1%.
CA Zip Codes
The distribution is based on data from 1,730 California zip codes.
Compared to U.S. Zip Codes, 93901 has a value of 15.1% which is in the best 50% of zip codes. Zip codes in the best 50% have a value lower than 16.5% while zip codes in the worst 25% have a value higher than 18.1%.
U.S. Zip Codes
The distribution is based on data from 31,435 U.S. zip codes.
Compared to the Monterey, CA County Value (14.9%), 93901 has a value of 15.1% which is higher and worse.
Monterey, CA County Value
(14.9%)
The regional value is compared to the Monterey County value.
Compared to the US Value (15.5%), 93901 has a value of 15.1% which is lower and better.
US Value
(15.5%)
The regional value is compared to the national value.

Adults who Binge Drink Zip Code: 93905

Current Value:

Adults who Binge Drink Zip Code: 93905

15.5%
(2021)
Compared to:
Compared to CA Zip Codes, 93905 has a value of 15.5% which is in the best 50% of zip codes. Zip codes in the best 50% have a value lower than 15.9% while zip codes in the worst 25% have a value higher than 17.1%.
CA Zip Codes
The distribution is based on data from 1,730 California zip codes.
Compared to U.S. Zip Codes, 93905 has a value of 15.5% which is in the best 50% of zip codes. Zip codes in the best 50% have a value lower than 16.5% while zip codes in the worst 25% have a value higher than 18.1%.
U.S. Zip Codes
The distribution is based on data from 31,435 U.S. zip codes.
Compared to the Monterey, CA County Value (14.9%), 93905 has a value of 15.5% which is higher and worse.
Monterey, CA County Value
(14.9%)
The regional value is compared to the Monterey County value.
Compared to the US Value (15.5%), 93905 has a value of 15.5%.
US Value
(15.5%)
The regional value is compared to the national value.

Adults who Binge Drink Zip Code: 93906

Current Value:

Adults who Binge Drink Zip Code: 93906

15.7%
(2021)
Compared to:
Compared to CA Zip Codes, 93906 has a value of 15.7% which is in the best 50% of zip codes. Zip codes in the best 50% have a value lower than 15.9% while zip codes in the worst 25% have a value higher than 17.1%.
CA Zip Codes
The distribution is based on data from 1,730 California zip codes.
Compared to U.S. Zip Codes, 93906 has a value of 15.7% which is in the best 50% of zip codes. Zip codes in the best 50% have a value lower than 16.5% while zip codes in the worst 25% have a value higher than 18.1%.
U.S. Zip Codes
The distribution is based on data from 31,435 U.S. zip codes.
Compared to the Monterey, CA County Value (14.9%), 93906 has a value of 15.7% which is higher and worse.
Monterey, CA County Value
(14.9%)
The regional value is compared to the Monterey County value.
Compared to the US Value (15.5%), 93906 has a value of 15.7% which is higher and worse.
US Value
(15.5%)
The regional value is compared to the national value.

Adults who Binge Drink Zip Code: 93907

Current Value:

Adults who Binge Drink Zip Code: 93907

15.7%
(2021)
Compared to:
Compared to CA Zip Codes, 93907 has a value of 15.7% which is in the best 50% of zip codes. Zip codes in the best 50% have a value lower than 15.9% while zip codes in the worst 25% have a value higher than 17.1%.
CA Zip Codes
The distribution is based on data from 1,730 California zip codes.
Compared to U.S. Zip Codes, 93907 has a value of 15.7% which is in the best 50% of zip codes. Zip codes in the best 50% have a value lower than 16.5% while zip codes in the worst 25% have a value higher than 18.1%.
U.S. Zip Codes
The distribution is based on data from 31,435 U.S. zip codes.
Compared to the Monterey, CA County Value (14.9%), 93907 has a value of 15.7% which is higher and worse.
Monterey, CA County Value
(14.9%)
The regional value is compared to the Monterey County value.
Compared to the US Value (15.5%), 93907 has a value of 15.7% which is higher and worse.
US Value
(15.5%)
The regional value is compared to the national value.

Adults who Binge Drink Zip Code: 93908

Current Value:

Adults who Binge Drink Zip Code: 93908

15.5%
(2021)
Compared to:
Compared to CA Zip Codes, 93908 has a value of 15.5% which is in the best 50% of zip codes. Zip codes in the best 50% have a value lower than 15.9% while zip codes in the worst 25% have a value higher than 17.1%.
CA Zip Codes
The distribution is based on data from 1,730 California zip codes.
Compared to U.S. Zip Codes, 93908 has a value of 15.5% which is in the best 50% of zip codes. Zip codes in the best 50% have a value lower than 16.5% while zip codes in the worst 25% have a value higher than 18.1%.
U.S. Zip Codes
The distribution is based on data from 31,435 U.S. zip codes.
Compared to the Monterey, CA County Value (14.9%), 93908 has a value of 15.5% which is higher and worse.
Monterey, CA County Value
(14.9%)
The regional value is compared to the Monterey County value.
Compared to the US Value (15.5%), 93908 has a value of 15.5%.
US Value
(15.5%)
The regional value is compared to the national value.

Adults who Binge Drink Zip Code: 93920

Current Value:

Adults who Binge Drink Zip Code: 93920

16.4%
(2021)
Compared to:
Compared to CA Zip Codes, 93920 has a value of 16.4% which is in the 2nd worst quartile of zip codes. Zip codes in the best 50% have a value lower than 15.9% while zip codes in the worst 25% have a value higher than 17.1%.
CA Zip Codes
The distribution is based on data from 1,730 California zip codes.
Compared to U.S. Zip Codes, 93920 has a value of 16.4% which is in the best 50% of zip codes. Zip codes in the best 50% have a value lower than 16.5% while zip codes in the worst 25% have a value higher than 18.1%.
U.S. Zip Codes
The distribution is based on data from 31,435 U.S. zip codes.
Compared to the Monterey, CA County Value (14.9%), 93920 has a value of 16.4% which is higher and worse.
Monterey, CA County Value
(14.9%)
The regional value is compared to the Monterey County value.
Compared to the US Value (15.5%), 93920 has a value of 16.4% which is higher and worse.
US Value
(15.5%)
The regional value is compared to the national value.

Adults who Binge Drink Zip Code: 93921

Current Value:

Adults who Binge Drink Zip Code: 93921

12.1%
(2021)
Compared to:
Compared to CA Zip Codes, 93921 has a value of 12.1% which is in the best 50% of zip codes. Zip codes in the best 50% have a value lower than 15.9% while zip codes in the worst 25% have a value higher than 17.1%.
CA Zip Codes
The distribution is based on data from 1,730 California zip codes.
Compared to U.S. Zip Codes, 93921 has a value of 12.1% which is in the best 50% of zip codes. Zip codes in the best 50% have a value lower than 16.5% while zip codes in the worst 25% have a value higher than 18.1%.
U.S. Zip Codes
The distribution is based on data from 31,435 U.S. zip codes.
Compared to the Monterey, CA County Value (14.9%), 93921 has a value of 12.1% which is lower and better.
Monterey, CA County Value
(14.9%)
The regional value is compared to the Monterey County value.
Compared to the US Value (15.5%), 93921 has a value of 12.1% which is lower and better.
US Value
(15.5%)
The regional value is compared to the national value.

Adults who Binge Drink Zip Code: 93923

Current Value:

Adults who Binge Drink Zip Code: 93923

11.5%
(2021)
Compared to:
Compared to CA Zip Codes, 93923 has a value of 11.5% which is in the best 50% of zip codes. Zip codes in the best 50% have a value lower than 15.9% while zip codes in the worst 25% have a value higher than 17.1%.
CA Zip Codes
The distribution is based on data from 1,730 California zip codes.
Compared to U.S. Zip Codes, 93923 has a value of 11.5% which is in the best 50% of zip codes. Zip codes in the best 50% have a value lower than 16.5% while zip codes in the worst 25% have a value higher than 18.1%.
U.S. Zip Codes
The distribution is based on data from 31,435 U.S. zip codes.
Compared to the Monterey, CA County Value (14.9%), 93923 has a value of 11.5% which is lower and better.
Monterey, CA County Value
(14.9%)
The regional value is compared to the Monterey County value.
Compared to the US Value (15.5%), 93923 has a value of 11.5% which is lower and better.
US Value
(15.5%)
The regional value is compared to the national value.

Adults who Binge Drink Zip Code: 93924

Current Value:

Adults who Binge Drink Zip Code: 93924

14.5%
(2021)
Compared to:
Compared to CA Zip Codes, 93924 has a value of 14.5% which is in the best 50% of zip codes. Zip codes in the best 50% have a value lower than 15.9% while zip codes in the worst 25% have a value higher than 17.1%.
CA Zip Codes
The distribution is based on data from 1,730 California zip codes.
Compared to U.S. Zip Codes, 93924 has a value of 14.5% which is in the best 50% of zip codes. Zip codes in the best 50% have a value lower than 16.5% while zip codes in the worst 25% have a value higher than 18.1%.
U.S. Zip Codes
The distribution is based on data from 31,435 U.S. zip codes.
Compared to the Monterey, CA County Value (14.9%), 93924 has a value of 14.5% which is lower and better.
Monterey, CA County Value
(14.9%)
The regional value is compared to the Monterey County value.
Compared to the US Value (15.5%), 93924 has a value of 14.5% which is lower and better.
US Value
(15.5%)
The regional value is compared to the national value.

Adults who Binge Drink Zip Code: 93925

Current Value:

Adults who Binge Drink Zip Code: 93925

16.3%
(2021)
Compared to:
Compared to CA Zip Codes, 93925 has a value of 16.3% which is in the 2nd worst quartile of zip codes. Zip codes in the best 50% have a value lower than 15.9% while zip codes in the worst 25% have a value higher than 17.1%.
CA Zip Codes
The distribution is based on data from 1,730 California zip codes.
Compared to U.S. Zip Codes, 93925 has a value of 16.3% which is in the best 50% of zip codes. Zip codes in the best 50% have a value lower than 16.5% while zip codes in the worst 25% have a value higher than 18.1%.
U.S. Zip Codes
The distribution is based on data from 31,435 U.S. zip codes.
Compared to the Monterey, CA County Value (14.9%), 93925 has a value of 16.3% which is higher and worse.
Monterey, CA County Value
(14.9%)
The regional value is compared to the Monterey County value.
Compared to the US Value (15.5%), 93925 has a value of 16.3% which is higher and worse.
US Value
(15.5%)
The regional value is compared to the national value.

Adults who Binge Drink Zip Code: 93926

Current Value:

Adults who Binge Drink Zip Code: 93926

16.1%
(2021)
Compared to:
Compared to CA Zip Codes, 93926 has a value of 16.1% which is in the 2nd worst quartile of zip codes. Zip codes in the best 50% have a value lower than 15.9% while zip codes in the worst 25% have a value higher than 17.1%.
CA Zip Codes
The distribution is based on data from 1,730 California zip codes.
Compared to U.S. Zip Codes, 93926 has a value of 16.1% which is in the best 50% of zip codes. Zip codes in the best 50% have a value lower than 16.5% while zip codes in the worst 25% have a value higher than 18.1%.
U.S. Zip Codes
The distribution is based on data from 31,435 U.S. zip codes.
Compared to the Monterey, CA County Value (14.9%), 93926 has a value of 16.1% which is higher and worse.
Monterey, CA County Value
(14.9%)
The regional value is compared to the Monterey County value.
Compared to the US Value (15.5%), 93926 has a value of 16.1% which is higher and worse.
US Value
(15.5%)
The regional value is compared to the national value.

Adults who Binge Drink Zip Code: 93927

Current Value:

Adults who Binge Drink Zip Code: 93927

16.5%
(2021)
Compared to:
Compared to CA Zip Codes, 93927 has a value of 16.5% which is in the 2nd worst quartile of zip codes. Zip codes in the best 50% have a value lower than 15.9% while zip codes in the worst 25% have a value higher than 17.1%.
CA Zip Codes
The distribution is based on data from 1,730 California zip codes.
Compared to U.S. Zip Codes, 93927 has a value of 16.5% which is in the best 50% of zip codes. Zip codes in the best 50% have a value lower than 16.5% while zip codes in the worst 25% have a value higher than 18.1%.
U.S. Zip Codes
The distribution is based on data from 31,435 U.S. zip codes.
Compared to the Monterey, CA County Value (14.9%), 93927 has a value of 16.5% which is higher and worse.
Monterey, CA County Value
(14.9%)
The regional value is compared to the Monterey County value.
Compared to the US Value (15.5%), 93927 has a value of 16.5% which is higher and worse.
US Value
(15.5%)
The regional value is compared to the national value.

Adults who Binge Drink Zip Code: 93928

Current Value:

Adults who Binge Drink Zip Code: 93928

21.5%
(2021)
Compared to:
Compared to CA Zip Codes, 93928 has a value of 21.5% which is in the worst 25% of zip codes. Zip codes in the best 50% have a value lower than 15.9% while zip codes in the worst 25% have a value higher than 17.1%.
CA Zip Codes
The distribution is based on data from 1,730 California zip codes.
Compared to U.S. Zip Codes, 93928 has a value of 21.5% which is in the worst 25% of zip codes. Zip codes in the best 50% have a value lower than 16.5% while zip codes in the worst 25% have a value higher than 18.1%.
U.S. Zip Codes
The distribution is based on data from 31,435 U.S. zip codes.
Compared to the Monterey, CA County Value (14.9%), 93928 has a value of 21.5% which is higher and worse.
Monterey, CA County Value
(14.9%)
The regional value is compared to the Monterey County value.
Compared to the US Value (15.5%), 93928 has a value of 21.5% which is higher and worse.
US Value
(15.5%)
The regional value is compared to the national value.

Adults who Binge Drink Zip Code: 93930

Current Value:

Adults who Binge Drink Zip Code: 93930

15.7%
(2021)
Compared to:
Compared to CA Zip Codes, 93930 has a value of 15.7% which is in the best 50% of zip codes. Zip codes in the best 50% have a value lower than 15.9% while zip codes in the worst 25% have a value higher than 17.1%.
CA Zip Codes
The distribution is based on data from 1,730 California zip codes.
Compared to U.S. Zip Codes, 93930 has a value of 15.7% which is in the best 50% of zip codes. Zip codes in the best 50% have a value lower than 16.5% while zip codes in the worst 25% have a value higher than 18.1%.
U.S. Zip Codes
The distribution is based on data from 31,435 U.S. zip codes.
Compared to the Monterey, CA County Value (14.9%), 93930 has a value of 15.7% which is higher and worse.
Monterey, CA County Value
(14.9%)
The regional value is compared to the Monterey County value.
Compared to the US Value (15.5%), 93930 has a value of 15.7% which is higher and worse.
US Value
(15.5%)
The regional value is compared to the national value.

Adults who Binge Drink Zip Code: 93932

Current Value:

Adults who Binge Drink Zip Code: 93932

14.4%
(2021)
Compared to:
Compared to CA Zip Codes, 93932 has a value of 14.4% which is in the best 50% of zip codes. Zip codes in the best 50% have a value lower than 15.9% while zip codes in the worst 25% have a value higher than 17.1%.
CA Zip Codes
The distribution is based on data from 1,730 California zip codes.
Compared to U.S. Zip Codes, 93932 has a value of 14.4% which is in the best 50% of zip codes. Zip codes in the best 50% have a value lower than 16.5% while zip codes in the worst 25% have a value higher than 18.1%.
U.S. Zip Codes
The distribution is based on data from 31,435 U.S. zip codes.
Compared to the Monterey, CA County Value (14.9%), 93932 has a value of 14.4% which is lower and better.
Monterey, CA County Value
(14.9%)
The regional value is compared to the Monterey County value.
Compared to the US Value (15.5%), 93932 has a value of 14.4% which is lower and better.
US Value
(15.5%)
The regional value is compared to the national value.

Adults who Binge Drink Zip Code: 93933

Current Value:

Adults who Binge Drink Zip Code: 93933

15.4%
(2021)
Compared to:
Compared to CA Zip Codes, 93933 has a value of 15.4% which is in the best 50% of zip codes. Zip codes in the best 50% have a value lower than 15.9% while zip codes in the worst 25% have a value higher than 17.1%.
CA Zip Codes
The distribution is based on data from 1,730 California zip codes.
Compared to U.S. Zip Codes, 93933 has a value of 15.4% which is in the best 50% of zip codes. Zip codes in the best 50% have a value lower than 16.5% while zip codes in the worst 25% have a value higher than 18.1%.
U.S. Zip Codes
The distribution is based on data from 31,435 U.S. zip codes.
Compared to the Monterey, CA County Value (14.9%), 93933 has a value of 15.4% which is higher and worse.
Monterey, CA County Value
(14.9%)
The regional value is compared to the Monterey County value.
Compared to the US Value (15.5%), 93933 has a value of 15.4% which is lower and better.
US Value
(15.5%)
The regional value is compared to the national value.

Adults who Binge Drink Zip Code: 93940

Current Value:

Adults who Binge Drink Zip Code: 93940

17.1%
(2021)
Compared to:
Compared to CA Zip Codes, 93940 has a value of 17.1% which is in the worst 25% of zip codes. Zip codes in the best 50% have a value lower than 15.9% while zip codes in the worst 25% have a value higher than 17.1%.
CA Zip Codes
The distribution is based on data from 1,730 California zip codes.
Compared to U.S. Zip Codes, 93940 has a value of 17.1% which is in the 2nd worst quartile of zip codes. Zip codes in the best 50% have a value lower than 16.5% while zip codes in the worst 25% have a value higher than 18.1%.
U.S. Zip Codes
The distribution is based on data from 31,435 U.S. zip codes.
Compared to the Monterey, CA County Value (14.9%), 93940 has a value of 17.1% which is higher and worse.
Monterey, CA County Value
(14.9%)
The regional value is compared to the Monterey County value.
Compared to the US Value (15.5%), 93940 has a value of 17.1% which is higher and worse.
US Value
(15.5%)
The regional value is compared to the national value.

Adults who Binge Drink Zip Code: 93950

Current Value:

Adults who Binge Drink Zip Code: 93950

14.8%
(2021)
Compared to:
Compared to CA Zip Codes, 93950 has a value of 14.8% which is in the best 50% of zip codes. Zip codes in the best 50% have a value lower than 15.9% while zip codes in the worst 25% have a value higher than 17.1%.
CA Zip Codes
The distribution is based on data from 1,730 California zip codes.
Compared to U.S. Zip Codes, 93950 has a value of 14.8% which is in the best 50% of zip codes. Zip codes in the best 50% have a value lower than 16.5% while zip codes in the worst 25% have a value higher than 18.1%.
U.S. Zip Codes
The distribution is based on data from 31,435 U.S. zip codes.
Compared to the Monterey, CA County Value (14.9%), 93950 has a value of 14.8% which is lower and better.
Monterey, CA County Value
(14.9%)
The regional value is compared to the Monterey County value.
Compared to the US Value (15.5%), 93950 has a value of 14.8% which is lower and better.
US Value
(15.5%)
The regional value is compared to the national value.

Adults who Binge Drink Zip Code: 93953

Current Value:

Adults who Binge Drink Zip Code: 93953

11.5%
(2021)
Compared to:
Compared to CA Zip Codes, 93953 has a value of 11.5% which is in the best 50% of zip codes. Zip codes in the best 50% have a value lower than 15.9% while zip codes in the worst 25% have a value higher than 17.1%.
CA Zip Codes
The distribution is based on data from 1,730 California zip codes.
Compared to U.S. Zip Codes, 93953 has a value of 11.5% which is in the best 50% of zip codes. Zip codes in the best 50% have a value lower than 16.5% while zip codes in the worst 25% have a value higher than 18.1%.
U.S. Zip Codes
The distribution is based on data from 31,435 U.S. zip codes.
Compared to the Monterey, CA County Value (14.9%), 93953 has a value of 11.5% which is lower and better.
Monterey, CA County Value
(14.9%)
The regional value is compared to the Monterey County value.
Compared to the US Value (15.5%), 93953 has a value of 11.5% which is lower and better.
US Value
(15.5%)
The regional value is compared to the national value.

Adults who Binge Drink Zip Code: 93954

Current Value:

Adults who Binge Drink Zip Code: 93954

15.0%
(2021)
Compared to:
Compared to CA Zip Codes, 93954 has a value of 15.0% which is in the best 50% of zip codes. Zip codes in the best 50% have a value lower than 15.9% while zip codes in the worst 25% have a value higher than 17.1%.
CA Zip Codes
The distribution is based on data from 1,730 California zip codes.
Compared to U.S. Zip Codes, 93954 has a value of 15.0% which is in the best 50% of zip codes. Zip codes in the best 50% have a value lower than 16.5% while zip codes in the worst 25% have a value higher than 18.1%.
U.S. Zip Codes
The distribution is based on data from 31,435 U.S. zip codes.
Compared to the Monterey, CA County Value (14.9%), 93954 has a value of 15.0% which is higher and worse.
Monterey, CA County Value
(14.9%)
The regional value is compared to the Monterey County value.
Compared to the US Value (15.5%), 93954 has a value of 15.0% which is lower and better.
US Value
(15.5%)
The regional value is compared to the national value.

Adults who Binge Drink Zip Code: 93955

Current Value:

Adults who Binge Drink Zip Code: 93955

16.4%
(2021)
Compared to:
Compared to CA Zip Codes, 93955 has a value of 16.4% which is in the 2nd worst quartile of zip codes. Zip codes in the best 50% have a value lower than 15.9% while zip codes in the worst 25% have a value higher than 17.1%.
CA Zip Codes
The distribution is based on data from 1,730 California zip codes.
Compared to U.S. Zip Codes, 93955 has a value of 16.4% which is in the best 50% of zip codes. Zip codes in the best 50% have a value lower than 16.5% while zip codes in the worst 25% have a value higher than 18.1%.
U.S. Zip Codes
The distribution is based on data from 31,435 U.S. zip codes.
Compared to the Monterey, CA County Value (14.9%), 93955 has a value of 16.4% which is higher and worse.
Monterey, CA County Value
(14.9%)
The regional value is compared to the Monterey County value.
Compared to the US Value (15.5%), 93955 has a value of 16.4% which is higher and worse.
US Value
(15.5%)
The regional value is compared to the national value.

Adults who Binge Drink Zip Code: 93960

Current Value:

Adults who Binge Drink Zip Code: 93960

19.0%
(2021)
Compared to:
Compared to CA Zip Codes, 93960 has a value of 19.0% which is in the worst 25% of zip codes. Zip codes in the best 50% have a value lower than 15.9% while zip codes in the worst 25% have a value higher than 17.1%.
CA Zip Codes
The distribution is based on data from 1,730 California zip codes.
Compared to U.S. Zip Codes, 93960 has a value of 19.0% which is in the worst 25% of zip codes. Zip codes in the best 50% have a value lower than 16.5% while zip codes in the worst 25% have a value higher than 18.1%.
U.S. Zip Codes
The distribution is based on data from 31,435 U.S. zip codes.
Compared to the Monterey, CA County Value (14.9%), 93960 has a value of 19.0% which is higher and worse.
Monterey, CA County Value
(14.9%)
The regional value is compared to the Monterey County value.
Compared to the US Value (15.5%), 93960 has a value of 19.0% which is higher and worse.
US Value
(15.5%)
The regional value is compared to the national value.

Adults who Binge Drink Zip Code: 93962

Current Value:

Adults who Binge Drink Zip Code: 93962

15.5%
(2021)
Compared to:
Compared to CA Zip Codes, 93962 has a value of 15.5% which is in the best 50% of zip codes. Zip codes in the best 50% have a value lower than 15.9% while zip codes in the worst 25% have a value higher than 17.1%.
CA Zip Codes
The distribution is based on data from 1,730 California zip codes.
Compared to U.S. Zip Codes, 93962 has a value of 15.5% which is in the best 50% of zip codes. Zip codes in the best 50% have a value lower than 16.5% while zip codes in the worst 25% have a value higher than 18.1%.
U.S. Zip Codes
The distribution is based on data from 31,435 U.S. zip codes.
Compared to the Monterey, CA County Value (14.9%), 93962 has a value of 15.5% which is higher and worse.
Monterey, CA County Value
(14.9%)
The regional value is compared to the Monterey County value.
Compared to the US Value (15.5%), 93962 has a value of 15.5%.
US Value
(15.5%)
The regional value is compared to the national value.

Adults who Binge Drink Zip Code: 95004

Current Value:

Adults who Binge Drink Zip Code: 95004

16.8%
(2021)
Compared to:
Compared to CA Zip Codes, 95004 has a value of 16.8% which is in the 2nd worst quartile of zip codes. Zip codes in the best 50% have a value lower than 15.9% while zip codes in the worst 25% have a value higher than 17.1%.
CA Zip Codes
The distribution is based on data from 1,730 California zip codes.
Compared to U.S. Zip Codes, 95004 has a value of 16.8% which is in the 2nd worst quartile of zip codes. Zip codes in the best 50% have a value lower than 16.5% while zip codes in the worst 25% have a value higher than 18.1%.
U.S. Zip Codes
The distribution is based on data from 31,435 U.S. zip codes.
Compared to the Monterey, CA County Value (14.9%), 95004 has a value of 16.8% which is higher and worse.
Monterey, CA County Value
(14.9%)
The regional value is compared to the Monterey County value.
Compared to the US Value (15.5%), 95004 has a value of 16.8% which is higher and worse.
US Value
(15.5%)
The regional value is compared to the national value.

Adults who Binge Drink Zip Code: 95012

Current Value:

Adults who Binge Drink Zip Code: 95012

16.0%
(2021)
Compared to:
Compared to CA Zip Codes, 95012 has a value of 16.0% which is in the 2nd worst quartile of zip codes. Zip codes in the best 50% have a value lower than 15.9% while zip codes in the worst 25% have a value higher than 17.1%.
CA Zip Codes
The distribution is based on data from 1,730 California zip codes.
Compared to U.S. Zip Codes, 95012 has a value of 16.0% which is in the best 50% of zip codes. Zip codes in the best 50% have a value lower than 16.5% while zip codes in the worst 25% have a value higher than 18.1%.
U.S. Zip Codes
The distribution is based on data from 31,435 U.S. zip codes.
Compared to the Monterey, CA County Value (14.9%), 95012 has a value of 16.0% which is higher and worse.
Monterey, CA County Value
(14.9%)
The regional value is compared to the Monterey County value.
Compared to the US Value (15.5%), 95012 has a value of 16.0% which is higher and worse.
US Value
(15.5%)
The regional value is compared to the national value.

Adults who Binge Drink Zip Code: 95039

Current Value:

Adults who Binge Drink Zip Code: 95039

14.6%
(2021)
Compared to:
Compared to CA Zip Codes, 95039 has a value of 14.6% which is in the best 50% of zip codes. Zip codes in the best 50% have a value lower than 15.9% while zip codes in the worst 25% have a value higher than 17.1%.
CA Zip Codes
The distribution is based on data from 1,730 California zip codes.
Compared to U.S. Zip Codes, 95039 has a value of 14.6% which is in the best 50% of zip codes. Zip codes in the best 50% have a value lower than 16.5% while zip codes in the worst 25% have a value higher than 18.1%.
U.S. Zip Codes
The distribution is based on data from 31,435 U.S. zip codes.
Compared to the Monterey, CA County Value (14.9%), 95039 has a value of 14.6% which is lower and better.
Monterey, CA County Value
(14.9%)
The regional value is compared to the Monterey County value.
Compared to the US Value (15.5%), 95039 has a value of 14.6% which is lower and better.
US Value
(15.5%)
The regional value is compared to the national value.

Adults who Binge Drink Zip Code: 95076

Current Value:

Adults who Binge Drink Zip Code: 95076

15.5%
(2021)
Compared to:
Compared to CA Zip Codes, 95076 has a value of 15.5% which is in the best 50% of zip codes. Zip codes in the best 50% have a value lower than 15.9% while zip codes in the worst 25% have a value higher than 17.1%.
CA Zip Codes
The distribution is based on data from 1,730 California zip codes.
Compared to U.S. Zip Codes, 95076 has a value of 15.5% which is in the best 50% of zip codes. Zip codes in the best 50% have a value lower than 16.5% while zip codes in the worst 25% have a value higher than 18.1%.
U.S. Zip Codes
The distribution is based on data from 31,435 U.S. zip codes.
Compared to the Santa Cruz, CA County Value (15.6%), 95076 has a value of 15.5% which is lower and better.
Santa Cruz, CA County Value
(15.6%)
The regional value is compared to the Santa Cruz County value.
Compared to the Monterey, CA County Value (14.9%), 95076 has a value of 15.5% which is higher and worse.
Monterey, CA County Value
(14.9%)
The regional value is compared to the Monterey County value.
Compared to the US Value (15.5%), 95076 has a value of 15.5%.
US Value
(15.5%)
The regional value is compared to the national value.

Adults who Binge Drink Census Tract: 06053000101

Current Value:

Adults who Binge Drink Census Tract: 06053000101

15.7%
(2021)
Compared to:
Compared to CA Census Tracts, 06053000101 has a value of 15.7% which is in the best 50% of census tracts. Census tracts in the best 50% have a value lower than 15.9% while census tracts in the worst 25% have a value higher than 17.2%.
CA Census Tracts
The distribution is based on data from 8,005 California census tracts.
Compared to U.S. Census Tracts, 06053000101 has a value of 15.7% which is in the best 50% of census tracts. Census tracts in the best 50% have a value lower than 16.5% while census tracts in the worst 25% have a value higher than 18.3%.
U.S. Census Tracts
The distribution is based on data from 68,167 U.S. census tracts.
Compared to the Monterey, CA County Value (14.9%), 06053000101 has a value of 15.7% which is higher and worse.
Monterey, CA County Value
(14.9%)
The regional value is compared to the Monterey County value.
Compared to the US Value (15.5%), 06053000101 has a value of 15.7% which is higher and worse.
US Value
(15.5%)
The regional value is compared to the national value.

Adults who Binge Drink Census Tract: 06053000102

Current Value:

Adults who Binge Drink Census Tract: 06053000102

15.2%
(2021)
Compared to:
Compared to CA Census Tracts, 06053000102 has a value of 15.2% which is in the best 50% of census tracts. Census tracts in the best 50% have a value lower than 15.9% while census tracts in the worst 25% have a value higher than 17.2%.
CA Census Tracts
The distribution is based on data from 8,005 California census tracts.
Compared to U.S. Census Tracts, 06053000102 has a value of 15.2% which is in the best 50% of census tracts. Census tracts in the best 50% have a value lower than 16.5% while census tracts in the worst 25% have a value higher than 18.3%.
U.S. Census Tracts
The distribution is based on data from 68,167 U.S. census tracts.
Compared to the Monterey, CA County Value (14.9%), 06053000102 has a value of 15.2% which is higher and worse.
Monterey, CA County Value
(14.9%)
The regional value is compared to the Monterey County value.
Compared to the US Value (15.5%), 06053000102 has a value of 15.2% which is lower and better.
US Value
(15.5%)
The regional value is compared to the national value.

Adults who Binge Drink Census Tract: 06053000103

Current Value:

Adults who Binge Drink Census Tract: 06053000103

14.1%
(2021)
Compared to:
Compared to CA Census Tracts, 06053000103 has a value of 14.1% which is in the best 50% of census tracts. Census tracts in the best 50% have a value lower than 15.9% while census tracts in the worst 25% have a value higher than 17.2%.
CA Census Tracts
The distribution is based on data from 8,005 California census tracts.
Compared to U.S. Census Tracts, 06053000103 has a value of 14.1% which is in the best 50% of census tracts. Census tracts in the best 50% have a value lower than 16.5% while census tracts in the worst 25% have a value higher than 18.3%.
U.S. Census Tracts
The distribution is based on data from 68,167 U.S. census tracts.
Compared to the Monterey, CA County Value (14.9%), 06053000103 has a value of 14.1% which is lower and better.
Monterey, CA County Value
(14.9%)
The regional value is compared to the Monterey County value.
Compared to the US Value (15.5%), 06053000103 has a value of 14.1% which is lower and better.
US Value
(15.5%)
The regional value is compared to the national value.

Adults who Binge Drink Census Tract: 06053000104

Current Value:

Adults who Binge Drink Census Tract: 06053000104

16.1%
(2021)
Compared to:
Compared to CA Census Tracts, 06053000104 has a value of 16.1% which is in the 2nd worst quartile of census tracts. Census tracts in the best 50% have a value lower than 15.9% while census tracts in the worst 25% have a value higher than 17.2%.
CA Census Tracts
The distribution is based on data from 8,005 California census tracts.
Compared to U.S. Census Tracts, 06053000104 has a value of 16.1% which is in the best 50% of census tracts. Census tracts in the best 50% have a value lower than 16.5% while census tracts in the worst 25% have a value higher than 18.3%.
U.S. Census Tracts
The distribution is based on data from 68,167 U.S. census tracts.
Compared to the Monterey, CA County Value (14.9%), 06053000104 has a value of 16.1% which is higher and worse.
Monterey, CA County Value
(14.9%)
The regional value is compared to the Monterey County value.
Compared to the US Value (15.5%), 06053000104 has a value of 16.1% which is higher and worse.
US Value
(15.5%)
The regional value is compared to the national value.

Adults who Binge Drink Census Tract: 06053000200

Current Value:

Adults who Binge Drink Census Tract: 06053000200

15.6%
(2021)
Compared to:
Compared to CA Census Tracts, 06053000200 has a value of 15.6% which is in the best 50% of census tracts. Census tracts in the best 50% have a value lower than 15.9% while census tracts in the worst 25% have a value higher than 17.2%.
CA Census Tracts
The distribution is based on data from 8,005 California census tracts.
Compared to U.S. Census Tracts, 06053000200 has a value of 15.6% which is in the best 50% of census tracts. Census tracts in the best 50% have a value lower than 16.5% while census tracts in the worst 25% have a value higher than 18.3%.
U.S. Census Tracts
The distribution is based on data from 68,167 U.S. census tracts.
Compared to the Monterey, CA County Value (14.9%), 06053000200 has a value of 15.6% which is higher and worse.
Monterey, CA County Value
(14.9%)
The regional value is compared to the Monterey County value.
Compared to the US Value (15.5%), 06053000200 has a value of 15.6% which is higher and worse.
US Value
(15.5%)
The regional value is compared to the national value.

Adults who Binge Drink Census Tract: 06053000300

Current Value:

Adults who Binge Drink Census Tract: 06053000300

14.9%
(2021)
Compared to:
Compared to CA Census Tracts, 06053000300 has a value of 14.9% which is in the best 50% of census tracts. Census tracts in the best 50% have a value lower than 15.9% while census tracts in the worst 25% have a value higher than 17.2%.
CA Census Tracts
The distribution is based on data from 8,005 California census tracts.
Compared to U.S. Census Tracts, 06053000300 has a value of 14.9% which is in the best 50% of census tracts. Census tracts in the best 50% have a value lower than 16.5% while census tracts in the worst 25% have a value higher than 18.3%.
U.S. Census Tracts
The distribution is based on data from 68,167 U.S. census tracts.
Compared to the Monterey, CA County Value (14.9%), 06053000300 has a value of 14.9%.
Monterey, CA County Value
(14.9%)
The regional value is compared to the Monterey County value.
Compared to the US Value (15.5%), 06053000300 has a value of 14.9% which is lower and better.
US Value
(15.5%)
The regional value is compared to the national value.

Adults who Binge Drink Census Tract: 06053000400

Current Value:

Adults who Binge Drink Census Tract: 06053000400

14.5%
(2021)
Compared to:
Compared to CA Census Tracts, 06053000400 has a value of 14.5% which is in the best 50% of census tracts. Census tracts in the best 50% have a value lower than 15.9% while census tracts in the worst 25% have a value higher than 17.2%.
CA Census Tracts
The distribution is based on data from 8,005 California census tracts.
Compared to U.S. Census Tracts, 06053000400 has a value of 14.5% which is in the best 50% of census tracts. Census tracts in the best 50% have a value lower than 16.5% while census tracts in the worst 25% have a value higher than 18.3%.
U.S. Census Tracts
The distribution is based on data from 68,167 U.S. census tracts.
Compared to the Monterey, CA County Value (14.9%), 06053000400 has a value of 14.5% which is lower and better.
Monterey, CA County Value
(14.9%)
The regional value is compared to the Monterey County value.
Compared to the US Value (15.5%), 06053000400 has a value of 14.5% which is lower and better.
US Value
(15.5%)
The regional value is compared to the national value.

Adults who Binge Drink Census Tract: 06053000501

Current Value:

Adults who Binge Drink Census Tract: 06053000501

14.7%
(2021)
Compared to:
Compared to CA Census Tracts, 06053000501 has a value of 14.7% which is in the best 50% of census tracts. Census tracts in the best 50% have a value lower than 15.9% while census tracts in the worst 25% have a value higher than 17.2%.
CA Census Tracts
The distribution is based on data from 8,005 California census tracts.
Compared to U.S. Census Tracts, 06053000501 has a value of 14.7% which is in the best 50% of census tracts. Census tracts in the best 50% have a value lower than 16.5% while census tracts in the worst 25% have a value higher than 18.3%.
U.S. Census Tracts
The distribution is based on data from 68,167 U.S. census tracts.
Compared to the Monterey, CA County Value (14.9%), 06053000501 has a value of 14.7% which is lower and better.
Monterey, CA County Value
(14.9%)
The regional value is compared to the Monterey County value.
Compared to the US Value (15.5%), 06053000501 has a value of 14.7% which is lower and better.
US Value
(15.5%)
The regional value is compared to the national value.

Adults who Binge Drink Census Tract: 06053000502

Current Value:

Adults who Binge Drink Census Tract: 06053000502

14.7%
(2021)
Compared to:
Compared to CA Census Tracts, 06053000502 has a value of 14.7% which is in the best 50% of census tracts. Census tracts in the best 50% have a value lower than 15.9% while census tracts in the worst 25% have a value higher than 17.2%.
CA Census Tracts
The distribution is based on data from 8,005 California census tracts.
Compared to U.S. Census Tracts, 06053000502 has a value of 14.7% which is in the best 50% of census tracts. Census tracts in the best 50% have a value lower than 16.5% while census tracts in the worst 25% have a value higher than 18.3%.
U.S. Census Tracts
The distribution is based on data from 68,167 U.S. census tracts.
Compared to the Monterey, CA County Value (14.9%), 06053000502 has a value of 14.7% which is lower and better.
Monterey, CA County Value
(14.9%)
The regional value is compared to the Monterey County value.
Compared to the US Value (15.5%), 06053000502 has a value of 14.7% which is lower and better.
US Value
(15.5%)
The regional value is compared to the national value.

Adults who Binge Drink Census Tract: 06053000600

Current Value:

Adults who Binge Drink Census Tract: 06053000600

14.9%
(2021)
Compared to:
Compared to CA Census Tracts, 06053000600 has a value of 14.9% which is in the best 50% of census tracts. Census tracts in the best 50% have a value lower than 15.9% while census tracts in the worst 25% have a value higher than 17.2%.
CA Census Tracts
The distribution is based on data from 8,005 California census tracts.
Compared to U.S. Census Tracts, 06053000600 has a value of 14.9% which is in the best 50% of census tracts. Census tracts in the best 50% have a value lower than 16.5% while census tracts in the worst 25% have a value higher than 18.3%.
U.S. Census Tracts
The distribution is based on data from 68,167 U.S. census tracts.
Compared to the Monterey, CA County Value (14.9%), 06053000600 has a value of 14.9%.
Monterey, CA County Value
(14.9%)
The regional value is compared to the Monterey County value.
Compared to the US Value (15.5%), 06053000600 has a value of 14.9% which is lower and better.
US Value
(15.5%)
The regional value is compared to the national value.

Adults who Binge Drink Census Tract: 06053000701

Current Value:

Adults who Binge Drink Census Tract: 06053000701

15.4%
(2021)
Compared to:
Compared to CA Census Tracts, 06053000701 has a value of 15.4% which is in the best 50% of census tracts. Census tracts in the best 50% have a value lower than 15.9% while census tracts in the worst 25% have a value higher than 17.2%.
CA Census Tracts
The distribution is based on data from 8,005 California census tracts.
Compared to U.S. Census Tracts, 06053000701 has a value of 15.4% which is in the best 50% of census tracts. Census tracts in the best 50% have a value lower than 16.5% while census tracts in the worst 25% have a value higher than 18.3%.
U.S. Census Tracts
The distribution is based on data from 68,167 U.S. census tracts.
Compared to the Monterey, CA County Value (14.9%), 06053000701 has a value of 15.4% which is higher and worse.
Monterey, CA County Value
(14.9%)
The regional value is compared to the Monterey County value.
Compared to the US Value (15.5%), 06053000701 has a value of 15.4% which is lower and better.
US Value
(15.5%)
The regional value is compared to the national value.

Adults who Binge Drink Census Tract: 06053000702

Current Value:

Adults who Binge Drink Census Tract: 06053000702

15.8%
(2021)
Compared to:
Compared to CA Census Tracts, 06053000702 has a value of 15.8% which is in the best 50% of census tracts. Census tracts in the best 50% have a value lower than 15.9% while census tracts in the worst 25% have a value higher than 17.2%.
CA Census Tracts
The distribution is based on data from 8,005 California census tracts.
Compared to U.S. Census Tracts, 06053000702 has a value of 15.8% which is in the best 50% of census tracts. Census tracts in the best 50% have a value lower than 16.5% while census tracts in the worst 25% have a value higher than 18.3%.
U.S. Census Tracts
The distribution is based on data from 68,167 U.S. census tracts.
Compared to the Monterey, CA County Value (14.9%), 06053000702 has a value of 15.8% which is higher and worse.
Monterey, CA County Value
(14.9%)
The regional value is compared to the Monterey County value.
Compared to the US Value (15.5%), 06053000702 has a value of 15.8% which is higher and worse.
US Value
(15.5%)
The regional value is compared to the national value.

Adults who Binge Drink Census Tract: 06053000800

Current Value:

Adults who Binge Drink Census Tract: 06053000800

15.2%
(2021)
Compared to:
Compared to CA Census Tracts, 06053000800 has a value of 15.2% which is in the best 50% of census tracts. Census tracts in the best 50% have a value lower than 15.9% while census tracts in the worst 25% have a value higher than 17.2%.
CA Census Tracts
The distribution is based on data from 8,005 California census tracts.
Compared to U.S. Census Tracts, 06053000800 has a value of 15.2% which is in the best 50% of census tracts. Census tracts in the best 50% have a value lower than 16.5% while census tracts in the worst 25% have a value higher than 18.3%.
U.S. Census Tracts
The distribution is based on data from 68,167 U.S. census tracts.
Compared to the Monterey, CA County Value (14.9%), 06053000800 has a value of 15.2% which is higher and worse.
Monterey, CA County Value
(14.9%)
The regional value is compared to the Monterey County value.
Compared to the US Value (15.5%), 06053000800 has a value of 15.2% which is lower and better.
US Value
(15.5%)
The regional value is compared to the national value.

Adults who Binge Drink Census Tract: 06053000900

Current Value:

Adults who Binge Drink Census Tract: 06053000900

14.6%
(2021)
Compared to:
Compared to CA Census Tracts, 06053000900 has a value of 14.6% which is in the best 50% of census tracts. Census tracts in the best 50% have a value lower than 15.9% while census tracts in the worst 25% have a value higher than 17.2%.
CA Census Tracts
The distribution is based on data from 8,005 California census tracts.
Compared to U.S. Census Tracts, 06053000900 has a value of 14.6% which is in the best 50% of census tracts. Census tracts in the best 50% have a value lower than 16.5% while census tracts in the worst 25% have a value higher than 18.3%.
U.S. Census Tracts
The distribution is based on data from 68,167 U.S. census tracts.
Compared to the Monterey, CA County Value (14.9%), 06053000900 has a value of 14.6% which is lower and better.
Monterey, CA County Value
(14.9%)
The regional value is compared to the Monterey County value.
Compared to the US Value (15.5%), 06053000900 has a value of 14.6% which is lower and better.
US Value
(15.5%)
The regional value is compared to the national value.

Adults who Binge Drink Census Tract: 06053001200

Current Value:

Adults who Binge Drink Census Tract: 06053001200

15.6%
(2021)
Compared to:
Compared to CA Census Tracts, 06053001200 has a value of 15.6% which is in the best 50% of census tracts. Census tracts in the best 50% have a value lower than 15.9% while census tracts in the worst 25% have a value higher than 17.2%.
CA Census Tracts
The distribution is based on data from 8,005 California census tracts.
Compared to U.S. Census Tracts, 06053001200 has a value of 15.6% which is in the best 50% of census tracts. Census tracts in the best 50% have a value lower than 16.5% while census tracts in the worst 25% have a value higher than 18.3%.
U.S. Census Tracts
The distribution is based on data from 68,167 U.S. census tracts.
Compared to the Monterey, CA County Value (14.9%), 06053001200 has a value of 15.6% which is higher and worse.
Monterey, CA County Value
(14.9%)
The regional value is compared to the Monterey County value.
Compared to the US Value (15.5%), 06053001200 has a value of 15.6% which is higher and worse.
US Value
(15.5%)
The regional value is compared to the national value.

Adults who Binge Drink Census Tract: 06053001300

Current Value:

Adults who Binge Drink Census Tract: 06053001300

14.4%
(2021)
Compared to:
Compared to CA Census Tracts, 06053001300 has a value of 14.4% which is in the best 50% of census tracts. Census tracts in the best 50% have a value lower than 15.9% while census tracts in the worst 25% have a value higher than 17.2%.
CA Census Tracts
The distribution is based on data from 8,005 California census tracts.
Compared to U.S. Census Tracts, 06053001300 has a value of 14.4% which is in the best 50% of census tracts. Census tracts in the best 50% have a value lower than 16.5% while census tracts in the worst 25% have a value higher than 18.3%.
U.S. Census Tracts
The distribution is based on data from 68,167 U.S. census tracts.
Compared to the Monterey, CA County Value (14.9%), 06053001300 has a value of 14.4% which is lower and better.
Monterey, CA County Value
(14.9%)
The regional value is compared to the Monterey County value.
Compared to the US Value (15.5%), 06053001300 has a value of 14.4% which is lower and better.
US Value
(15.5%)
The regional value is compared to the national value.

Adults who Binge Drink Census Tract: 06053001400

Current Value:

Adults who Binge Drink Census Tract: 06053001400

15.8%
(2021)
Compared to:
Compared to CA Census Tracts, 06053001400 has a value of 15.8% which is in the best 50% of census tracts. Census tracts in the best 50% have a value lower than 15.9% while census tracts in the worst 25% have a value higher than 17.2%.
CA Census Tracts
The distribution is based on data from 8,005 California census tracts.
Compared to U.S. Census Tracts, 06053001400 has a value of 15.8% which is in the best 50% of census tracts. Census tracts in the best 50% have a value lower than 16.5% while census tracts in the worst 25% have a value higher than 18.3%.
U.S. Census Tracts
The distribution is based on data from 68,167 U.S. census tracts.
Compared to the Monterey, CA County Value (14.9%), 06053001400 has a value of 15.8% which is higher and worse.
Monterey, CA County Value
(14.9%)
The regional value is compared to the Monterey County value.
Compared to the US Value (15.5%), 06053001400 has a value of 15.8% which is higher and worse.
US Value
(15.5%)
The regional value is compared to the national value.

Adults who Binge Drink Census Tract: 06053001500

Current Value:

Adults who Binge Drink Census Tract: 06053001500

14.9%
(2021)
Compared to:
Compared to CA Census Tracts, 06053001500 has a value of 14.9% which is in the best 50% of census tracts. Census tracts in the best 50% have a value lower than 15.9% while census tracts in the worst 25% have a value higher than 17.2%.
CA Census Tracts
The distribution is based on data from 8,005 California census tracts.
Compared to U.S. Census Tracts, 06053001500 has a value of 14.9% which is in the best 50% of census tracts. Census tracts in the best 50% have a value lower than 16.5% while census tracts in the worst 25% have a value higher than 18.3%.
U.S. Census Tracts
The distribution is based on data from 68,167 U.S. census tracts.
Compared to the Monterey, CA County Value (14.9%), 06053001500 has a value of 14.9%.
Monterey, CA County Value
(14.9%)
The regional value is compared to the Monterey County value.
Compared to the US Value (15.5%), 06053001500 has a value of 14.9% which is lower and better.
US Value
(15.5%)
The regional value is compared to the national value.

Adults who Binge Drink Census Tract: 06053001600

Current Value:

Adults who Binge Drink Census Tract: 06053001600

15.1%
(2021)
Compared to:
Compared to CA Census Tracts, 06053001600 has a value of 15.1% which is in the best 50% of census tracts. Census tracts in the best 50% have a value lower than 15.9% while census tracts in the worst 25% have a value higher than 17.2%.
CA Census Tracts
The distribution is based on data from 8,005 California census tracts.
Compared to U.S. Census Tracts, 06053001600 has a value of 15.1% which is in the best 50% of census tracts. Census tracts in the best 50% have a value lower than 16.5% while census tracts in the worst 25% have a value higher than 18.3%.
U.S. Census Tracts
The distribution is based on data from 68,167 U.S. census tracts.
Compared to the Monterey, CA County Value (14.9%), 06053001600 has a value of 15.1% which is higher and worse.
Monterey, CA County Value
(14.9%)
The regional value is compared to the Monterey County value.
Compared to the US Value (15.5%), 06053001600 has a value of 15.1% which is lower and better.
US Value
(15.5%)
The regional value is compared to the national value.

Adults who Binge Drink Census Tract: 06053001700

Current Value:

Adults who Binge Drink Census Tract: 06053001700

15.8%
(2021)
Compared to:
Compared to CA Census Tracts, 06053001700 has a value of 15.8% which is in the best 50% of census tracts. Census tracts in the best 50% have a value lower than 15.9% while census tracts in the worst 25% have a value higher than 17.2%.
CA Census Tracts
The distribution is based on data from 8,005 California census tracts.
Compared to U.S. Census Tracts, 06053001700 has a value of 15.8% which is in the best 50% of census tracts. Census tracts in the best 50% have a value lower than 16.5% while census tracts in the worst 25% have a value higher than 18.3%.
U.S. Census Tracts
The distribution is based on data from 68,167 U.S. census tracts.
Compared to the Monterey, CA County Value (14.9%), 06053001700 has a value of 15.8% which is higher and worse.
Monterey, CA County Value
(14.9%)
The regional value is compared to the Monterey County value.
Compared to the US Value (15.5%), 06053001700 has a value of 15.8% which is higher and worse.
US Value
(15.5%)
The regional value is compared to the national value.

Adults who Binge Drink Census Tract: 06053001801

Current Value:

Adults who Binge Drink Census Tract: 06053001801

15.2%
(2021)
Compared to:
Compared to CA Census Tracts, 06053001801 has a value of 15.2% which is in the best 50% of census tracts. Census tracts in the best 50% have a value lower than 15.9% while census tracts in the worst 25% have a value higher than 17.2%.
CA Census Tracts
The distribution is based on data from 8,005 California census tracts.
Compared to U.S. Census Tracts, 06053001801 has a value of 15.2% which is in the best 50% of census tracts. Census tracts in the best 50% have a value lower than 16.5% while census tracts in the worst 25% have a value higher than 18.3%.
U.S. Census Tracts
The distribution is based on data from 68,167 U.S. census tracts.
Compared to the Monterey, CA County Value (14.9%), 06053001801 has a value of 15.2% which is higher and worse.
Monterey, CA County Value
(14.9%)
The regional value is compared to the Monterey County value.
Compared to the US Value (15.5%), 06053001801 has a value of 15.2% which is lower and better.
US Value
(15.5%)
The regional value is compared to the national value.

Adults who Binge Drink Census Tract: 06053001802

Current Value:

Adults who Binge Drink Census Tract: 06053001802

16.1%
(2021)
Compared to:
Compared to CA Census Tracts, 06053001802 has a value of 16.1% which is in the 2nd worst quartile of census tracts. Census tracts in the best 50% have a value lower than 15.9% while census tracts in the worst 25% have a value higher than 17.2%.
CA Census Tracts
The distribution is based on data from 8,005 California census tracts.
Compared to U.S. Census Tracts, 06053001802 has a value of 16.1% which is in the best 50% of census tracts. Census tracts in the best 50% have a value lower than 16.5% while census tracts in the worst 25% have a value higher than 18.3%.
U.S. Census Tracts
The distribution is based on data from 68,167 U.S. census tracts.
Compared to the Monterey, CA County Value (14.9%), 06053001802 has a value of 16.1% which is higher and worse.
Monterey, CA County Value
(14.9%)
The regional value is compared to the Monterey County value.
Compared to the US Value (15.5%), 06053001802 has a value of 16.1% which is higher and worse.
US Value
(15.5%)
The regional value is compared to the national value.

Adults who Binge Drink Census Tract: 06053010101

Current Value:

Adults who Binge Drink Census Tract: 06053010101

15.2%
(2021)
Compared to:
Compared to CA Census Tracts, 06053010101 has a value of 15.2% which is in the best 50% of census tracts. Census tracts in the best 50% have a value lower than 15.9% while census tracts in the worst 25% have a value higher than 17.2%.
CA Census Tracts
The distribution is based on data from 8,005 California census tracts.
Compared to U.S. Census Tracts, 06053010101 has a value of 15.2% which is in the best 50% of census tracts. Census tracts in the best 50% have a value lower than 16.5% while census tracts in the worst 25% have a value higher than 18.3%.
U.S. Census Tracts
The distribution is based on data from 68,167 U.S. census tracts.
Compared to the Monterey, CA County Value (14.9%), 06053010101 has a value of 15.2% which is higher and worse.
Monterey, CA County Value
(14.9%)
The regional value is compared to the Monterey County value.
Compared to the US Value (15.5%), 06053010101 has a value of 15.2% which is lower and better.
US Value
(15.5%)
The regional value is compared to the national value.

Adults who Binge Drink Census Tract: 06053010102

Current Value:

Adults who Binge Drink Census Tract: 06053010102

17.0%
(2021)
Compared to:
Compared to CA Census Tracts, 06053010102 has a value of 17.0% which is in the 2nd worst quartile of census tracts. Census tracts in the best 50% have a value lower than 15.9% while census tracts in the worst 25% have a value higher than 17.2%.
CA Census Tracts
The distribution is based on data from 8,005 California census tracts.
Compared to U.S. Census Tracts, 06053010102 has a value of 17.0% which is in the 2nd worst quartile of census tracts. Census tracts in the best 50% have a value lower than 16.5% while census tracts in the worst 25% have a value higher than 18.3%.
U.S. Census Tracts
The distribution is based on data from 68,167 U.S. census tracts.
Compared to the Monterey, CA County Value (14.9%), 06053010102 has a value of 17.0% which is higher and worse.
Monterey, CA County Value
(14.9%)
The regional value is compared to the Monterey County value.
Compared to the US Value (15.5%), 06053010102 has a value of 17.0% which is higher and worse.
US Value
(15.5%)
The regional value is compared to the national value.

Adults who Binge Drink Census Tract: 06053010202

Current Value:

Adults who Binge Drink Census Tract: 06053010202

16.1%
(2021)
Compared to:
Compared to CA Census Tracts, 06053010202 has a value of 16.1% which is in the 2nd worst quartile of census tracts. Census tracts in the best 50% have a value lower than 15.9% while census tracts in the worst 25% have a value higher than 17.2%.
CA Census Tracts
The distribution is based on data from 8,005 California census tracts.
Compared to U.S. Census Tracts, 06053010202 has a value of 16.1% which is in the best 50% of census tracts. Census tracts in the best 50% have a value lower than 16.5% while census tracts in the worst 25% have a value higher than 18.3%.
U.S. Census Tracts
The distribution is based on data from 68,167 U.S. census tracts.
Compared to the Monterey, CA County Value (14.9%), 06053010202 has a value of 16.1% which is higher and worse.
Monterey, CA County Value
(14.9%)
The regional value is compared to the Monterey County value.
Compared to the US Value (15.5%), 06053010202 has a value of 16.1% which is higher and worse.
US Value
(15.5%)
The regional value is compared to the national value.

Adults who Binge Drink Census Tract: 06053010305

Current Value:

Adults who Binge Drink Census Tract: 06053010305

16.7%
(2021)
Compared to:
Compared to CA Census Tracts, 06053010305 has a value of 16.7% which is in the 2nd worst quartile of census tracts. Census tracts in the best 50% have a value lower than 15.9% while census tracts in the worst 25% have a value higher than 17.2%.
CA Census Tracts
The distribution is based on data from 8,005 California census tracts.
Compared to U.S. Census Tracts, 06053010305 has a value of 16.7% which is in the 2nd worst quartile of census tracts. Census tracts in the best 50% have a value lower than 16.5% while census tracts in the worst 25% have a value higher than 18.3%.
U.S. Census Tracts
The distribution is based on data from 68,167 U.S. census tracts.
Compared to the Monterey, CA County Value (14.9%), 06053010305 has a value of 16.7% which is higher and worse.
Monterey, CA County Value
(14.9%)
The regional value is compared to the Monterey County value.
Compared to the US Value (15.5%), 06053010305 has a value of 16.7% which is higher and worse.
US Value
(15.5%)
The regional value is compared to the national value.

Adults who Binge Drink Census Tract: 06053010306

Current Value:

Adults who Binge Drink Census Tract: 06053010306

15.8%
(2021)
Compared to:
Compared to CA Census Tracts, 06053010306 has a value of 15.8% which is in the best 50% of census tracts. Census tracts in the best 50% have a value lower than 15.9% while census tracts in the worst 25% have a value higher than 17.2%.
CA Census Tracts
The distribution is based on data from 8,005 California census tracts.
Compared to U.S. Census Tracts, 06053010306 has a value of 15.8% which is in the best 50% of census tracts. Census tracts in the best 50% have a value lower than 16.5% while census tracts in the worst 25% have a value higher than 18.3%.
U.S. Census Tracts
The distribution is based on data from 68,167 U.S. census tracts.
Compared to the Monterey, CA County Value (14.9%), 06053010306 has a value of 15.8% which is higher and worse.
Monterey, CA County Value
(14.9%)
The regional value is compared to the Monterey County value.
Compared to the US Value (15.5%), 06053010306 has a value of 15.8% which is higher and worse.
US Value
(15.5%)
The regional value is compared to the national value.

Adults who Binge Drink Census Tract: 06053010400

Current Value:

Adults who Binge Drink Census Tract: 06053010400

15.5%
(2021)
Compared to:
Compared to CA Census Tracts, 06053010400 has a value of 15.5% which is in the best 50% of census tracts. Census tracts in the best 50% have a value lower than 15.9% while census tracts in the worst 25% have a value higher than 17.2%.
CA Census Tracts
The distribution is based on data from 8,005 California census tracts.
Compared to U.S. Census Tracts, 06053010400 has a value of 15.5% which is in the best 50% of census tracts. Census tracts in the best 50% have a value lower than 16.5% while census tracts in the worst 25% have a value higher than 18.3%.
U.S. Census Tracts
The distribution is based on data from 68,167 U.S. census tracts.
Compared to the Monterey, CA County Value (14.9%), 06053010400 has a value of 15.5% which is higher and worse.
Monterey, CA County Value
(14.9%)
The regional value is compared to the Monterey County value.
Compared to the US Value (15.5%), 06053010400 has a value of 15.5%.
US Value
(15.5%)
The regional value is compared to the national value.

Adults who Binge Drink Census Tract: 06053010501

Current Value:

Adults who Binge Drink Census Tract: 06053010501

15.4%
(2021)
Compared to:
Compared to CA Census Tracts, 06053010501 has a value of 15.4% which is in the best 50% of census tracts. Census tracts in the best 50% have a value lower than 15.9% while census tracts in the worst 25% have a value higher than 17.2%.
CA Census Tracts
The distribution is based on data from 8,005 California census tracts.
Compared to U.S. Census Tracts, 06053010501 has a value of 15.4% which is in the best 50% of census tracts. Census tracts in the best 50% have a value lower than 16.5% while census tracts in the worst 25% have a value higher than 18.3%.
U.S. Census Tracts
The distribution is based on data from 68,167 U.S. census tracts.
Compared to the Monterey, CA County Value (14.9%), 06053010501 has a value of 15.4% which is higher and worse.
Monterey, CA County Value
(14.9%)
The regional value is compared to the Monterey County value.
Compared to the US Value (15.5%), 06053010501 has a value of 15.4% which is lower and better.
US Value
(15.5%)
The regional value is compared to the national value.

Adults who Binge Drink Census Tract: 06053010504

Current Value:

Adults who Binge Drink Census Tract: 06053010504

16.9%
(2021)
Compared to:
Compared to CA Census Tracts, 06053010504 has a value of 16.9% which is in the 2nd worst quartile of census tracts. Census tracts in the best 50% have a value lower than 15.9% while census tracts in the worst 25% have a value higher than 17.2%.
CA Census Tracts
The distribution is based on data from 8,005 California census tracts.
Compared to U.S. Census Tracts, 06053010504 has a value of 16.9% which is in the 2nd worst quartile of census tracts. Census tracts in the best 50% have a value lower than 16.5% while census tracts in the worst 25% have a value higher than 18.3%.
U.S. Census Tracts
The distribution is based on data from 68,167 U.S. census tracts.
Compared to the Monterey, CA County Value (14.9%), 06053010504 has a value of 16.9% which is higher and worse.
Monterey, CA County Value
(14.9%)
The regional value is compared to the Monterey County value.
Compared to the US Value (15.5%), 06053010504 has a value of 16.9% which is higher and worse.
US Value
(15.5%)
The regional value is compared to the national value.

Adults who Binge Drink Census Tract: 06053010505

Current Value:

Adults who Binge Drink Census Tract: 06053010505

15.6%
(2021)
Compared to:
Compared to CA Census Tracts, 06053010505 has a value of 15.6% which is in the best 50% of census tracts. Census tracts in the best 50% have a value lower than 15.9% while census tracts in the worst 25% have a value higher than 17.2%.
CA Census Tracts
The distribution is based on data from 8,005 California census tracts.
Compared to U.S. Census Tracts, 06053010505 has a value of 15.6% which is in the best 50% of census tracts. Census tracts in the best 50% have a value lower than 16.5% while census tracts in the worst 25% have a value higher than 18.3%.
U.S. Census Tracts
The distribution is based on data from 68,167 U.S. census tracts.
Compared to the Monterey, CA County Value (14.9%), 06053010505 has a value of 15.6% which is higher and worse.
Monterey, CA County Value
(14.9%)
The regional value is compared to the Monterey County value.
Compared to the US Value (15.5%), 06053010505 has a value of 15.6% which is higher and worse.
US Value
(15.5%)
The regional value is compared to the national value.

Adults who Binge Drink Census Tract: 06053010506

Current Value:

Adults who Binge Drink Census Tract: 06053010506

16.0%
(2021)
Compared to:
Compared to CA Census Tracts, 06053010506 has a value of 16.0% which is in the 2nd worst quartile of census tracts. Census tracts in the best 50% have a value lower than 15.9% while census tracts in the worst 25% have a value higher than 17.2%.
CA Census Tracts
The distribution is based on data from 8,005 California census tracts.
Compared to U.S. Census Tracts, 06053010506 has a value of 16.0% which is in the best 50% of census tracts. Census tracts in the best 50% have a value lower than 16.5% while census tracts in the worst 25% have a value higher than 18.3%.
U.S. Census Tracts
The distribution is based on data from 68,167 U.S. census tracts.
Compared to the Monterey, CA County Value (14.9%), 06053010506 has a value of 16.0% which is higher and worse.
Monterey, CA County Value
(14.9%)
The regional value is compared to the Monterey County value.
Compared to the US Value (15.5%), 06053010506 has a value of 16.0% which is higher and worse.
US Value
(15.5%)
The regional value is compared to the national value.

Adults who Binge Drink Census Tract: 06053010603

Current Value:

Adults who Binge Drink Census Tract: 06053010603

17.2%
(2021)
Compared to:
Compared to CA Census Tracts, 06053010603 has a value of 17.2% which is in the worst 25% of census tracts. Census tracts in the best 50% have a value lower than 15.9% while census tracts in the worst 25% have a value higher than 17.2%.
CA Census Tracts
The distribution is based on data from 8,005 California census tracts.
Compared to U.S. Census Tracts, 06053010603 has a value of 17.2% which is in the 2nd worst quartile of census tracts. Census tracts in the best 50% have a value lower than 16.5% while census tracts in the worst 25% have a value higher than 18.3%.
U.S. Census Tracts
The distribution is based on data from 68,167 U.S. census tracts.
Compared to the Monterey, CA County Value (14.9%), 06053010603 has a value of 17.2% which is higher and worse.
Monterey, CA County Value
(14.9%)
The regional value is compared to the Monterey County value.
Compared to the US Value (15.5%), 06053010603 has a value of 17.2% which is higher and worse.
US Value
(15.5%)
The regional value is compared to the national value.

Adults who Binge Drink Census Tract: 06053010604

Current Value:

Adults who Binge Drink Census Tract: 06053010604

16.2%
(2021)
Compared to:
Compared to CA Census Tracts, 06053010604 has a value of 16.2% which is in the 2nd worst quartile of census tracts. Census tracts in the best 50% have a value lower than 15.9% while census tracts in the worst 25% have a value higher than 17.2%.
CA Census Tracts
The distribution is based on data from 8,005 California census tracts.
Compared to U.S. Census Tracts, 06053010604 has a value of 16.2% which is in the best 50% of census tracts. Census tracts in the best 50% have a value lower than 16.5% while census tracts in the worst 25% have a value higher than 18.3%.
U.S. Census Tracts
The distribution is based on data from 68,167 U.S. census tracts.
Compared to the Monterey, CA County Value (14.9%), 06053010604 has a value of 16.2% which is higher and worse.
Monterey, CA County Value
(14.9%)
The regional value is compared to the Monterey County value.
Compared to the US Value (15.5%), 06053010604 has a value of 16.2% which is higher and worse.
US Value
(15.5%)
The regional value is compared to the national value.

Adults who Binge Drink Census Tract: 06053010605

Current Value:

Adults who Binge Drink Census Tract: 06053010605

17.3%
(2021)
Compared to:
Compared to CA Census Tracts, 06053010605 has a value of 17.3% which is in the worst 25% of census tracts. Census tracts in the best 50% have a value lower than 15.9% while census tracts in the worst 25% have a value higher than 17.2%.
CA Census Tracts
The distribution is based on data from 8,005 California census tracts.
Compared to U.S. Census Tracts, 06053010605 has a value of 17.3% which is in the 2nd worst quartile of census tracts. Census tracts in the best 50% have a value lower than 16.5% while census tracts in the worst 25% have a value higher than 18.3%.
U.S. Census Tracts
The distribution is based on data from 68,167 U.S. census tracts.
Compared to the Monterey, CA County Value (14.9%), 06053010605 has a value of 17.3% which is higher and worse.
Monterey, CA County Value
(14.9%)
The regional value is compared to the Monterey County value.
Compared to the US Value (15.5%), 06053010605 has a value of 17.3% which is higher and worse.
US Value
(15.5%)
The regional value is compared to the national value.

Adults who Binge Drink Census Tract: 06053010606

Current Value:

Adults who Binge Drink Census Tract: 06053010606

16.2%
(2021)
Compared to:
Compared to CA Census Tracts, 06053010606 has a value of 16.2% which is in the 2nd worst quartile of census tracts. Census tracts in the best 50% have a value lower than 15.9% while census tracts in the worst 25% have a value higher than 17.2%.
CA Census Tracts
The distribution is based on data from 8,005 California census tracts.
Compared to U.S. Census Tracts, 06053010606 has a value of 16.2% which is in the best 50% of census tracts. Census tracts in the best 50% have a value lower than 16.5% while census tracts in the worst 25% have a value higher than 18.3%.
U.S. Census Tracts
The distribution is based on data from 68,167 U.S. census tracts.
Compared to the Monterey, CA County Value (14.9%), 06053010606 has a value of 16.2% which is higher and worse.
Monterey, CA County Value
(14.9%)
The regional value is compared to the Monterey County value.
Compared to the US Value (15.5%), 06053010606 has a value of 16.2% which is higher and worse.
US Value
(15.5%)
The regional value is compared to the national value.

Adults who Binge Drink Census Tract: 06053010607

Current Value:

Adults who Binge Drink Census Tract: 06053010607

15.2%
(2021)
Compared to:
Compared to CA Census Tracts, 06053010607 has a value of 15.2% which is in the best 50% of census tracts. Census tracts in the best 50% have a value lower than 15.9% while census tracts in the worst 25% have a value higher than 17.2%.
CA Census Tracts
The distribution is based on data from 8,005 California census tracts.
Compared to U.S. Census Tracts, 06053010607 has a value of 15.2% which is in the best 50% of census tracts. Census tracts in the best 50% have a value lower than 16.5% while census tracts in the worst 25% have a value higher than 18.3%.
U.S. Census Tracts
The distribution is based on data from 68,167 U.S. census tracts.
Compared to the Monterey, CA County Value (14.9%), 06053010607 has a value of 15.2% which is higher and worse.
Monterey, CA County Value
(14.9%)
The regional value is compared to the Monterey County value.
Compared to the US Value (15.5%), 06053010607 has a value of 15.2% which is lower and better.
US Value
(15.5%)
The regional value is compared to the national value.

Adults who Binge Drink Census Tract: 06053010608

Current Value:

Adults who Binge Drink Census Tract: 06053010608

18.4%
(2021)
Compared to:
Compared to CA Census Tracts, 06053010608 has a value of 18.4% which is in the worst 25% of census tracts. Census tracts in the best 50% have a value lower than 15.9% while census tracts in the worst 25% have a value higher than 17.2%.
CA Census Tracts
The distribution is based on data from 8,005 California census tracts.
Compared to U.S. Census Tracts, 06053010608 has a value of 18.4% which is in the worst 25% of census tracts. Census tracts in the best 50% have a value lower than 16.5% while census tracts in the worst 25% have a value higher than 18.3%.
U.S. Census Tracts
The distribution is based on data from 68,167 U.S. census tracts.
Compared to the Monterey, CA County Value (14.9%), 06053010608 has a value of 18.4% which is higher and worse.
Monterey, CA County Value
(14.9%)
The regional value is compared to the Monterey County value.
Compared to the US Value (15.5%), 06053010608 has a value of 18.4% which is higher and worse.
US Value
(15.5%)
The regional value is compared to the national value.

Adults who Binge Drink Census Tract: 06053010701

Current Value:

Adults who Binge Drink Census Tract: 06053010701

16.4%
(2021)
Compared to:
Compared to CA Census Tracts, 06053010701 has a value of 16.4% which is in the 2nd worst quartile of census tracts. Census tracts in the best 50% have a value lower than 15.9% while census tracts in the worst 25% have a value higher than 17.2%.
CA Census Tracts
The distribution is based on data from 8,005 California census tracts.
Compared to U.S. Census Tracts, 06053010701 has a value of 16.4% which is in the best 50% of census tracts. Census tracts in the best 50% have a value lower than 16.5% while census tracts in the worst 25% have a value higher than 18.3%.
U.S. Census Tracts
The distribution is based on data from 68,167 U.S. census tracts.
Compared to the Monterey, CA County Value (14.9%), 06053010701 has a value of 16.4% which is higher and worse.
Monterey, CA County Value
(14.9%)
The regional value is compared to the Monterey County value.
Compared to the US Value (15.5%), 06053010701 has a value of 16.4% which is higher and worse.
US Value
(15.5%)
The regional value is compared to the national value.

Adults who Binge Drink Census Tract: 06053010702

Current Value:

Adults who Binge Drink Census Tract: 06053010702

14.2%
(2021)
Compared to:
Compared to CA Census Tracts, 06053010702 has a value of 14.2% which is in the best 50% of census tracts. Census tracts in the best 50% have a value lower than 15.9% while census tracts in the worst 25% have a value higher than 17.2%.
CA Census Tracts
The distribution is based on data from 8,005 California census tracts.
Compared to U.S. Census Tracts, 06053010702 has a value of 14.2% which is in the best 50% of census tracts. Census tracts in the best 50% have a value lower than 16.5% while census tracts in the worst 25% have a value higher than 18.3%.
U.S. Census Tracts
The distribution is based on data from 68,167 U.S. census tracts.
Compared to the Monterey, CA County Value (14.9%), 06053010702 has a value of 14.2% which is lower and better.
Monterey, CA County Value
(14.9%)
The regional value is compared to the Monterey County value.
Compared to the US Value (15.5%), 06053010702 has a value of 14.2% which is lower and better.
US Value
(15.5%)
The regional value is compared to the national value.

Adults who Binge Drink Census Tract: 06053010804

Current Value:

Adults who Binge Drink Census Tract: 06053010804

15.4%
(2021)
Compared to:
Compared to CA Census Tracts, 06053010804 has a value of 15.4% which is in the best 50% of census tracts. Census tracts in the best 50% have a value lower than 15.9% while census tracts in the worst 25% have a value higher than 17.2%.
CA Census Tracts
The distribution is based on data from 8,005 California census tracts.
Compared to U.S. Census Tracts, 06053010804 has a value of 15.4% which is in the best 50% of census tracts. Census tracts in the best 50% have a value lower than 16.5% while census tracts in the worst 25% have a value higher than 18.3%.
U.S. Census Tracts
The distribution is based on data from 68,167 U.S. census tracts.
Compared to the Monterey, CA County Value (14.9%), 06053010804 has a value of 15.4% which is higher and worse.
Monterey, CA County Value
(14.9%)
The regional value is compared to the Monterey County value.
Compared to the US Value (15.5%), 06053010804 has a value of 15.4% which is lower and better.
US Value
(15.5%)
The regional value is compared to the national value.

Adults who Binge Drink Census Tract: 06053010900

Current Value:

Adults who Binge Drink Census Tract: 06053010900

22.6%
(2021)
Compared to:
Compared to CA Census Tracts, 06053010900 has a value of 22.6% which is in the worst 25% of census tracts. Census tracts in the best 50% have a value lower than 15.9% while census tracts in the worst 25% have a value higher than 17.2%.
CA Census Tracts
The distribution is based on data from 8,005 California census tracts.
Compared to U.S. Census Tracts, 06053010900 has a value of 22.6% which is in the worst 25% of census tracts. Census tracts in the best 50% have a value lower than 16.5% while census tracts in the worst 25% have a value higher than 18.3%.
U.S. Census Tracts
The distribution is based on data from 68,167 U.S. census tracts.
Compared to the Monterey, CA County Value (14.9%), 06053010900 has a value of 22.6% which is higher and worse.
Monterey, CA County Value
(14.9%)
The regional value is compared to the Monterey County value.
Compared to the US Value (15.5%), 06053010900 has a value of 22.6% which is higher and worse.
US Value
(15.5%)
The regional value is compared to the national value.

Adults who Binge Drink Census Tract: 06053011000

Current Value:

Adults who Binge Drink Census Tract: 06053011000

14.2%
(2021)
Compared to:
Compared to CA Census Tracts, 06053011000 has a value of 14.2% which is in the best 50% of census tracts. Census tracts in the best 50% have a value lower than 15.9% while census tracts in the worst 25% have a value higher than 17.2%.
CA Census Tracts
The distribution is based on data from 8,005 California census tracts.
Compared to U.S. Census Tracts, 06053011000 has a value of 14.2% which is in the best 50% of census tracts. Census tracts in the best 50% have a value lower than 16.5% while census tracts in the worst 25% have a value higher than 18.3%.
U.S. Census Tracts
The distribution is based on data from 68,167 U.S. census tracts.
Compared to the Monterey, CA County Value (14.9%), 06053011000 has a value of 14.2% which is lower and better.
Monterey, CA County Value
(14.9%)
The regional value is compared to the Monterey County value.
Compared to the US Value (15.5%), 06053011000 has a value of 14.2% which is lower and better.
US Value
(15.5%)
The regional value is compared to the national value.

Adults who Binge Drink Census Tract: 06053011101

Current Value:

Adults who Binge Drink Census Tract: 06053011101

14.4%
(2021)
Compared to:
Compared to CA Census Tracts, 06053011101 has a value of 14.4% which is in the best 50% of census tracts. Census tracts in the best 50% have a value lower than 15.9% while census tracts in the worst 25% have a value higher than 17.2%.
CA Census Tracts
The distribution is based on data from 8,005 California census tracts.
Compared to U.S. Census Tracts, 06053011101 has a value of 14.4% which is in the best 50% of census tracts. Census tracts in the best 50% have a value lower than 16.5% while census tracts in the worst 25% have a value higher than 18.3%.
U.S. Census Tracts
The distribution is based on data from 68,167 U.S. census tracts.
Compared to the Monterey, CA County Value (14.9%), 06053011101 has a value of 14.4% which is lower and better.
Monterey, CA County Value
(14.9%)
The regional value is compared to the Monterey County value.
Compared to the US Value (15.5%), 06053011101 has a value of 14.4% which is lower and better.
US Value
(15.5%)
The regional value is compared to the national value.

Adults who Binge Drink Census Tract: 06053011102

Current Value:

Adults who Binge Drink Census Tract: 06053011102

16.2%
(2021)
Compared to:
Compared to CA Census Tracts, 06053011102 has a value of 16.2% which is in the 2nd worst quartile of census tracts. Census tracts in the best 50% have a value lower than 15.9% while census tracts in the worst 25% have a value higher than 17.2%.
CA Census Tracts
The distribution is based on data from 8,005 California census tracts.
Compared to U.S. Census Tracts, 06053011102 has a value of 16.2% which is in the best 50% of census tracts. Census tracts in the best 50% have a value lower than 16.5% while census tracts in the worst 25% have a value higher than 18.3%.
U.S. Census Tracts
The distribution is based on data from 68,167 U.S. census tracts.
Compared to the Monterey, CA County Value (14.9%), 06053011102 has a value of 16.2% which is higher and worse.
Monterey, CA County Value
(14.9%)
The regional value is compared to the Monterey County value.
Compared to the US Value (15.5%), 06053011102 has a value of 16.2% which is higher and worse.
US Value
(15.5%)
The regional value is compared to the national value.

Adults who Binge Drink Census Tract: 06053011202

Current Value:

Adults who Binge Drink Census Tract: 06053011202

16.3%
(2021)
Compared to:
Compared to CA Census Tracts, 06053011202 has a value of 16.3% which is in the 2nd worst quartile of census tracts. Census tracts in the best 50% have a value lower than 15.9% while census tracts in the worst 25% have a value higher than 17.2%.
CA Census Tracts
The distribution is based on data from 8,005 California census tracts.
Compared to U.S. Census Tracts, 06053011202 has a value of 16.3% which is in the best 50% of census tracts. Census tracts in the best 50% have a value lower than 16.5% while census tracts in the worst 25% have a value higher than 18.3%.
U.S. Census Tracts
The distribution is based on data from 68,167 U.S. census tracts.
Compared to the Monterey, CA County Value (14.9%), 06053011202 has a value of 16.3% which is higher and worse.
Monterey, CA County Value
(14.9%)
The regional value is compared to the Monterey County value.
Compared to the US Value (15.5%), 06053011202 has a value of 16.3% which is higher and worse.
US Value
(15.5%)
The regional value is compared to the national value.

Adults who Binge Drink Census Tract: 06053011203

Current Value:

Adults who Binge Drink Census Tract: 06053011203

17.0%
(2021)
Compared to:
Compared to CA Census Tracts, 06053011203 has a value of 17.0% which is in the 2nd worst quartile of census tracts. Census tracts in the best 50% have a value lower than 15.9% while census tracts in the worst 25% have a value higher than 17.2%.
CA Census Tracts
The distribution is based on data from 8,005 California census tracts.
Compared to U.S. Census Tracts, 06053011203 has a value of 17.0% which is in the 2nd worst quartile of census tracts. Census tracts in the best 50% have a value lower than 16.5% while census tracts in the worst 25% have a value higher than 18.3%.
U.S. Census Tracts
The distribution is based on data from 68,167 U.S. census tracts.
Compared to the Monterey, CA County Value (14.9%), 06053011203 has a value of 17.0% which is higher and worse.
Monterey, CA County Value
(14.9%)
The regional value is compared to the Monterey County value.
Compared to the US Value (15.5%), 06053011203 has a value of 17.0% which is higher and worse.
US Value
(15.5%)
The regional value is compared to the national value.

Adults who Binge Drink Census Tract: 06053011204

Current Value:

Adults who Binge Drink Census Tract: 06053011204

16.0%
(2021)
Compared to:
Compared to CA Census Tracts, 06053011204 has a value of 16.0% which is in the 2nd worst quartile of census tracts. Census tracts in the best 50% have a value lower than 15.9% while census tracts in the worst 25% have a value higher than 17.2%.
CA Census Tracts
The distribution is based on data from 8,005 California census tracts.
Compared to U.S. Census Tracts, 06053011204 has a value of 16.0% which is in the best 50% of census tracts. Census tracts in the best 50% have a value lower than 16.5% while census tracts in the worst 25% have a value higher than 18.3%.
U.S. Census Tracts
The distribution is based on data from 68,167 U.S. census tracts.
Compared to the Monterey, CA County Value (14.9%), 06053011204 has a value of 16.0% which is higher and worse.
Monterey, CA County Value
(14.9%)
The regional value is compared to the Monterey County value.
Compared to the US Value (15.5%), 06053011204 has a value of 16.0% which is higher and worse.
US Value
(15.5%)
The regional value is compared to the national value.

Adults who Binge Drink Census Tract: 06053011302

Current Value:

Adults who Binge Drink Census Tract: 06053011302

16.1%
(2021)
Compared to:
Compared to CA Census Tracts, 06053011302 has a value of 16.1% which is in the 2nd worst quartile of census tracts. Census tracts in the best 50% have a value lower than 15.9% while census tracts in the worst 25% have a value higher than 17.2%.
CA Census Tracts
The distribution is based on data from 8,005 California census tracts.
Compared to U.S. Census Tracts, 06053011302 has a value of 16.1% which is in the best 50% of census tracts. Census tracts in the best 50% have a value lower than 16.5% while census tracts in the worst 25% have a value higher than 18.3%.
U.S. Census Tracts
The distribution is based on data from 68,167 U.S. census tracts.
Compared to the Monterey, CA County Value (14.9%), 06053011302 has a value of 16.1% which is higher and worse.
Monterey, CA County Value
(14.9%)
The regional value is compared to the Monterey County value.
Compared to the US Value (15.5%), 06053011302 has a value of 16.1% which is higher and worse.
US Value
(15.5%)
The regional value is compared to the national value.

Adults who Binge Drink Census Tract: 06053011303

Current Value:

Adults who Binge Drink Census Tract: 06053011303

15.2%
(2021)
Compared to:
Compared to CA Census Tracts, 06053011303 has a value of 15.2% which is in the best 50% of census tracts. Census tracts in the best 50% have a value lower than 15.9% while census tracts in the worst 25% have a value higher than 17.2%.
CA Census Tracts
The distribution is based on data from 8,005 California census tracts.
Compared to U.S. Census Tracts, 06053011303 has a value of 15.2% which is in the best 50% of census tracts. Census tracts in the best 50% have a value lower than 16.5% while census tracts in the worst 25% have a value higher than 18.3%.
U.S. Census Tracts
The distribution is based on data from 68,167 U.S. census tracts.
Compared to the Monterey, CA County Value (14.9%), 06053011303 has a value of 15.2% which is higher and worse.
Monterey, CA County Value
(14.9%)
The regional value is compared to the Monterey County value.
Compared to the US Value (15.5%), 06053011303 has a value of 15.2% which is lower and better.
US Value
(15.5%)
The regional value is compared to the national value.

Adults who Binge Drink Census Tract: 06053011304

Current Value:

Adults who Binge Drink Census Tract: 06053011304

15.6%
(2021)
Compared to:
Compared to CA Census Tracts, 06053011304 has a value of 15.6% which is in the best 50% of census tracts. Census tracts in the best 50% have a value lower than 15.9% while census tracts in the worst 25% have a value higher than 17.2%.
CA Census Tracts
The distribution is based on data from 8,005 California census tracts.
Compared to U.S. Census Tracts, 06053011304 has a value of 15.6% which is in the best 50% of census tracts. Census tracts in the best 50% have a value lower than 16.5% while census tracts in the worst 25% have a value higher than 18.3%.
U.S. Census Tracts
The distribution is based on data from 68,167 U.S. census tracts.
Compared to the Monterey, CA County Value (14.9%), 06053011304 has a value of 15.6% which is higher and worse.
Monterey, CA County Value
(14.9%)
The regional value is compared to the Monterey County value.
Compared to the US Value (15.5%), 06053011304 has a value of 15.6% which is higher and worse.
US Value
(15.5%)
The regional value is compared to the national value.

Adults who Binge Drink Census Tract: 06053011400

Current Value:

Adults who Binge Drink Census Tract: 06053011400

16.5%
(2021)
Compared to:
Compared to CA Census Tracts, 06053011400 has a value of 16.5% which is in the 2nd worst quartile of census tracts. Census tracts in the best 50% have a value lower than 15.9% while census tracts in the worst 25% have a value higher than 17.2%.
CA Census Tracts
The distribution is based on data from 8,005 California census tracts.
Compared to U.S. Census Tracts, 06053011400 has a value of 16.5% which is in the best 50% of census tracts. Census tracts in the best 50% have a value lower than 16.5% while census tracts in the worst 25% have a value higher than 18.3%.
U.S. Census Tracts
The distribution is based on data from 68,167 U.S. census tracts.
Compared to the Monterey, CA County Value (14.9%), 06053011400 has a value of 16.5% which is higher and worse.
Monterey, CA County Value
(14.9%)
The regional value is compared to the Monterey County value.
Compared to the US Value (15.5%), 06053011400 has a value of 16.5% which is higher and worse.
US Value
(15.5%)
The regional value is compared to the national value.

Adults who Binge Drink Census Tract: 06053011502

Current Value:

Adults who Binge Drink Census Tract: 06053011502

16.2%
(2021)
Compared to:
Compared to CA Census Tracts, 06053011502 has a value of 16.2% which is in the 2nd worst quartile of census tracts. Census tracts in the best 50% have a value lower than 15.9% while census tracts in the worst 25% have a value higher than 17.2%.
CA Census Tracts
The distribution is based on data from 8,005 California census tracts.
Compared to U.S. Census Tracts, 06053011502 has a value of 16.2% which is in the best 50% of census tracts. Census tracts in the best 50% have a value lower than 16.5% while census tracts in the worst 25% have a value higher than 18.3%.
U.S. Census Tracts
The distribution is based on data from 68,167 U.S. census tracts.
Compared to the Monterey, CA County Value (14.9%), 06053011502 has a value of 16.2% which is higher and worse.
Monterey, CA County Value
(14.9%)
The regional value is compared to the Monterey County value.
Compared to the US Value (15.5%), 06053011502 has a value of 16.2% which is higher and worse.
US Value
(15.5%)
The regional value is compared to the national value.

Adults who Binge Drink Census Tract: 06053011602

Current Value:

Adults who Binge Drink Census Tract: 06053011602

10.5%
(2021)
Compared to:
Compared to CA Census Tracts, 06053011602 has a value of 10.5% which is in the best 50% of census tracts. Census tracts in the best 50% have a value lower than 15.9% while census tracts in the worst 25% have a value higher than 17.2%.
CA Census Tracts
The distribution is based on data from 8,005 California census tracts.
Compared to U.S. Census Tracts, 06053011602 has a value of 10.5% which is in the best 50% of census tracts. Census tracts in the best 50% have a value lower than 16.5% while census tracts in the worst 25% have a value higher than 18.3%.
U.S. Census Tracts
The distribution is based on data from 68,167 U.S. census tracts.
Compared to the Monterey, CA County Value (14.9%), 06053011602 has a value of 10.5% which is lower and better.
Monterey, CA County Value
(14.9%)
The regional value is compared to the Monterey County value.
Compared to the US Value (15.5%), 06053011602 has a value of 10.5% which is lower and better.
US Value
(15.5%)
The regional value is compared to the national value.

Adults who Binge Drink Census Tract: 06053011604

Current Value:

Adults who Binge Drink Census Tract: 06053011604

10.9%
(2021)
Compared to:
Compared to CA Census Tracts, 06053011604 has a value of 10.9% which is in the best 50% of census tracts. Census tracts in the best 50% have a value lower than 15.9% while census tracts in the worst 25% have a value higher than 17.2%.
CA Census Tracts
The distribution is based on data from 8,005 California census tracts.
Compared to U.S. Census Tracts, 06053011604 has a value of 10.9% which is in the best 50% of census tracts. Census tracts in the best 50% have a value lower than 16.5% while census tracts in the worst 25% have a value higher than 18.3%.
U.S. Census Tracts
The distribution is based on data from 68,167 U.S. census tracts.
Compared to the Monterey, CA County Value (14.9%), 06053011604 has a value of 10.9% which is lower and better.
Monterey, CA County Value
(14.9%)
The regional value is compared to the Monterey County value.
Compared to the US Value (15.5%), 06053011604 has a value of 10.9% which is lower and better.
US Value
(15.5%)
The regional value is compared to the national value.

Adults who Binge Drink Census Tract: 06053011700

Current Value:

Adults who Binge Drink Census Tract: 06053011700

12.8%
(2021)
Compared to:
Compared to CA Census Tracts, 06053011700 has a value of 12.8% which is in the best 50% of census tracts. Census tracts in the best 50% have a value lower than 15.9% while census tracts in the worst 25% have a value higher than 17.2%.
CA Census Tracts
The distribution is based on data from 8,005 California census tracts.
Compared to U.S. Census Tracts, 06053011700 has a value of 12.8% which is in the best 50% of census tracts. Census tracts in the best 50% have a value lower than 16.5% while census tracts in the worst 25% have a value higher than 18.3%.
U.S. Census Tracts
The distribution is based on data from 68,167 U.S. census tracts.
Compared to the Monterey, CA County Value (14.9%), 06053011700 has a value of 12.8% which is lower and better.
Monterey, CA County Value
(14.9%)
The regional value is compared to the Monterey County value.
Compared to the US Value (15.5%), 06053011700 has a value of 12.8% which is lower and better.
US Value
(15.5%)
The regional value is compared to the national value.

Adults who Binge Drink Census Tract: 06053011801

Current Value:

Adults who Binge Drink Census Tract: 06053011801

13.4%
(2021)
Compared to:
Compared to CA Census Tracts, 06053011801 has a value of 13.4% which is in the best 50% of census tracts. Census tracts in the best 50% have a value lower than 15.9% while census tracts in the worst 25% have a value higher than 17.2%.
CA Census Tracts
The distribution is based on data from 8,005 California census tracts.
Compared to U.S. Census Tracts, 06053011801 has a value of 13.4% which is in the best 50% of census tracts. Census tracts in the best 50% have a value lower than 16.5% while census tracts in the worst 25% have a value higher than 18.3%.
U.S. Census Tracts
The distribution is based on data from 68,167 U.S. census tracts.
Compared to the Monterey, CA County Value (14.9%), 06053011801 has a value of 13.4% which is lower and better.
Monterey, CA County Value
(14.9%)
The regional value is compared to the Monterey County value.
Compared to the US Value (15.5%), 06053011801 has a value of 13.4% which is lower and better.
US Value
(15.5%)
The regional value is compared to the national value.

Adults who Binge Drink Census Tract: 06053011802

Current Value:

Adults who Binge Drink Census Tract: 06053011802

10.9%
(2021)
Compared to:
Compared to CA Census Tracts, 06053011802 has a value of 10.9% which is in the best 50% of census tracts. Census tracts in the best 50% have a value lower than 15.9% while census tracts in the worst 25% have a value higher than 17.2%.
CA Census Tracts
The distribution is based on data from 8,005 California census tracts.
Compared to U.S. Census Tracts, 06053011802 has a value of 10.9% which is in the best 50% of census tracts. Census tracts in the best 50% have a value lower than 16.5% while census tracts in the worst 25% have a value higher than 18.3%.
U.S. Census Tracts
The distribution is based on data from 68,167 U.S. census tracts.
Compared to the Monterey, CA County Value (14.9%), 06053011802 has a value of 10.9% which is lower and better.
Monterey, CA County Value
(14.9%)
The regional value is compared to the Monterey County value.
Compared to the US Value (15.5%), 06053011802 has a value of 10.9% which is lower and better.
US Value
(15.5%)
The regional value is compared to the national value.

Adults who Binge Drink Census Tract: 06053011900

Current Value:

Adults who Binge Drink Census Tract: 06053011900

11.5%
(2021)
Compared to:
Compared to CA Census Tracts, 06053011900 has a value of 11.5% which is in the best 50% of census tracts. Census tracts in the best 50% have a value lower than 15.9% while census tracts in the worst 25% have a value higher than 17.2%.
CA Census Tracts
The distribution is based on data from 8,005 California census tracts.
Compared to U.S. Census Tracts, 06053011900 has a value of 11.5% which is in the best 50% of census tracts. Census tracts in the best 50% have a value lower than 16.5% while census tracts in the worst 25% have a value higher than 18.3%.
U.S. Census Tracts
The distribution is based on data from 68,167 U.S. census tracts.
Compared to the Monterey, CA County Value (14.9%), 06053011900 has a value of 11.5% which is lower and better.
Monterey, CA County Value
(14.9%)
The regional value is compared to the Monterey County value.
Compared to the US Value (15.5%), 06053011900 has a value of 11.5% which is lower and better.
US Value
(15.5%)
The regional value is compared to the national value.

Adults who Binge Drink Census Tract: 06053012000

Current Value:

Adults who Binge Drink Census Tract: 06053012000

15.5%
(2021)
Compared to:
Compared to CA Census Tracts, 06053012000 has a value of 15.5% which is in the best 50% of census tracts. Census tracts in the best 50% have a value lower than 15.9% while census tracts in the worst 25% have a value higher than 17.2%.
CA Census Tracts
The distribution is based on data from 8,005 California census tracts.
Compared to U.S. Census Tracts, 06053012000 has a value of 15.5% which is in the best 50% of census tracts. Census tracts in the best 50% have a value lower than 16.5% while census tracts in the worst 25% have a value higher than 18.3%.
U.S. Census Tracts
The distribution is based on data from 68,167 U.S. census tracts.
Compared to the Monterey, CA County Value (14.9%), 06053012000 has a value of 15.5% which is higher and worse.
Monterey, CA County Value
(14.9%)
The regional value is compared to the Monterey County value.
Compared to the US Value (15.5%), 06053012000 has a value of 15.5%.
US Value
(15.5%)
The regional value is compared to the national value.

Adults who Binge Drink Census Tract: 06053012100

Current Value:

Adults who Binge Drink Census Tract: 06053012100

12.3%
(2021)
Compared to:
Compared to CA Census Tracts, 06053012100 has a value of 12.3% which is in the best 50% of census tracts. Census tracts in the best 50% have a value lower than 15.9% while census tracts in the worst 25% have a value higher than 17.2%.
CA Census Tracts
The distribution is based on data from 8,005 California census tracts.
Compared to U.S. Census Tracts, 06053012100 has a value of 12.3% which is in the best 50% of census tracts. Census tracts in the best 50% have a value lower than 16.5% while census tracts in the worst 25% have a value higher than 18.3%.
U.S. Census Tracts
The distribution is based on data from 68,167 U.S. census tracts.
Compared to the Monterey, CA County Value (14.9%), 06053012100 has a value of 12.3% which is lower and better.
Monterey, CA County Value
(14.9%)
The regional value is compared to the Monterey County value.
Compared to the US Value (15.5%), 06053012100 has a value of 12.3% which is lower and better.
US Value
(15.5%)
The regional value is compared to the national value.

Adults who Binge Drink Census Tract: 06053012200

Current Value:

Adults who Binge Drink Census Tract: 06053012200

16.1%
(2021)
Compared to:
Compared to CA Census Tracts, 06053012200 has a value of 16.1% which is in the 2nd worst quartile of census tracts. Census tracts in the best 50% have a value lower than 15.9% while census tracts in the worst 25% have a value higher than 17.2%.
CA Census Tracts
The distribution is based on data from 8,005 California census tracts.
Compared to U.S. Census Tracts, 06053012200 has a value of 16.1% which is in the best 50% of census tracts. Census tracts in the best 50% have a value lower than 16.5% while census tracts in the worst 25% have a value higher than 18.3%.
U.S. Census Tracts
The distribution is based on data from 68,167 U.S. census tracts.
Compared to the Monterey, CA County Value (14.9%), 06053012200 has a value of 16.1% which is higher and worse.
Monterey, CA County Value
(14.9%)
The regional value is compared to the Monterey County value.
Compared to the US Value (15.5%), 06053012200 has a value of 16.1% which is higher and worse.
US Value
(15.5%)
The regional value is compared to the national value.

Adults who Binge Drink Census Tract: 06053012302

Current Value:

Adults who Binge Drink Census Tract: 06053012302

15.6%
(2021)
Compared to:
Compared to CA Census Tracts, 06053012302 has a value of 15.6% which is in the best 50% of census tracts. Census tracts in the best 50% have a value lower than 15.9% while census tracts in the worst 25% have a value higher than 17.2%.
CA Census Tracts
The distribution is based on data from 8,005 California census tracts.
Compared to U.S. Census Tracts, 06053012302 has a value of 15.6% which is in the best 50% of census tracts. Census tracts in the best 50% have a value lower than 16.5% while census tracts in the worst 25% have a value higher than 18.3%.
U.S. Census Tracts
The distribution is based on data from 68,167 U.S. census tracts.
Compared to the Monterey, CA County Value (14.9%), 06053012302 has a value of 15.6% which is higher and worse.
Monterey, CA County Value
(14.9%)
The regional value is compared to the Monterey County value.
Compared to the US Value (15.5%), 06053012302 has a value of 15.6% which is higher and worse.
US Value
(15.5%)
The regional value is compared to the national value.

Adults who Binge Drink Census Tract: 06053012401

Current Value:

Adults who Binge Drink Census Tract: 06053012401

14.3%
(2021)
Compared to:
Compared to CA Census Tracts, 06053012401 has a value of 14.3% which is in the best 50% of census tracts. Census tracts in the best 50% have a value lower than 15.9% while census tracts in the worst 25% have a value higher than 17.2%.
CA Census Tracts
The distribution is based on data from 8,005 California census tracts.
Compared to U.S. Census Tracts, 06053012401 has a value of 14.3% which is in the best 50% of census tracts. Census tracts in the best 50% have a value lower than 16.5% while census tracts in the worst 25% have a value higher than 18.3%.
U.S. Census Tracts
The distribution is based on data from 68,167 U.S. census tracts.
Compared to the Monterey, CA County Value (14.9%), 06053012401 has a value of 14.3% which is lower and better.
Monterey, CA County Value
(14.9%)
The regional value is compared to the Monterey County value.
Compared to the US Value (15.5%), 06053012401 has a value of 14.3% which is lower and better.
US Value
(15.5%)
The regional value is compared to the national value.

Adults who Binge Drink Census Tract: 06053012402

Current Value:

Adults who Binge Drink Census Tract: 06053012402

14.5%
(2021)
Compared to:
Compared to CA Census Tracts, 06053012402 has a value of 14.5% which is in the best 50% of census tracts. Census tracts in the best 50% have a value lower than 15.9% while census tracts in the worst 25% have a value higher than 17.2%.
CA Census Tracts
The distribution is based on data from 8,005 California census tracts.
Compared to U.S. Census Tracts, 06053012402 has a value of 14.5% which is in the best 50% of census tracts. Census tracts in the best 50% have a value lower than 16.5% while census tracts in the worst 25% have a value higher than 18.3%.
U.S. Census Tracts
The distribution is based on data from 68,167 U.S. census tracts.
Compared to the Monterey, CA County Value (14.9%), 06053012402 has a value of 14.5% which is lower and better.
Monterey, CA County Value
(14.9%)
The regional value is compared to the Monterey County value.
Compared to the US Value (15.5%), 06053012402 has a value of 14.5% which is lower and better.
US Value
(15.5%)
The regional value is compared to the national value.

Adults who Binge Drink Census Tract: 06053012502

Current Value:

Adults who Binge Drink Census Tract: 06053012502

17.4%
(2021)
Compared to:
Compared to CA Census Tracts, 06053012502 has a value of 17.4% which is in the worst 25% of census tracts. Census tracts in the best 50% have a value lower than 15.9% while census tracts in the worst 25% have a value higher than 17.2%.
CA Census Tracts
The distribution is based on data from 8,005 California census tracts.
Compared to U.S. Census Tracts, 06053012502 has a value of 17.4% which is in the 2nd worst quartile of census tracts. Census tracts in the best 50% have a value lower than 16.5% while census tracts in the worst 25% have a value higher than 18.3%.
U.S. Census Tracts
The distribution is based on data from 68,167 U.S. census tracts.
Compared to the Monterey, CA County Value (14.9%), 06053012502 has a value of 17.4% which is higher and worse.
Monterey, CA County Value
(14.9%)
The regional value is compared to the Monterey County value.
Compared to the US Value (15.5%), 06053012502 has a value of 17.4% which is higher and worse.
US Value
(15.5%)
The regional value is compared to the national value.

Adults who Binge Drink Census Tract: 06053012600

Current Value:

Adults who Binge Drink Census Tract: 06053012600

28.2%
(2021)
Compared to:
Compared to CA Census Tracts, 06053012600 has a value of 28.2% which is in the worst 25% of census tracts. Census tracts in the best 50% have a value lower than 15.9% while census tracts in the worst 25% have a value higher than 17.2%.
CA Census Tracts
The distribution is based on data from 8,005 California census tracts.
Compared to U.S. Census Tracts, 06053012600 has a value of 28.2% which is in the worst 25% of census tracts. Census tracts in the best 50% have a value lower than 16.5% while census tracts in the worst 25% have a value higher than 18.3%.
U.S. Census Tracts
The distribution is based on data from 68,167 U.S. census tracts.
Compared to the Monterey, CA County Value (14.9%), 06053012600 has a value of 28.2% which is higher and worse.
Monterey, CA County Value
(14.9%)
The regional value is compared to the Monterey County value.
Compared to the US Value (15.5%), 06053012600 has a value of 28.2% which is higher and worse.
US Value
(15.5%)
The regional value is compared to the national value.

Adults who Binge Drink Census Tract: 06053012700

Current Value:

Adults who Binge Drink Census Tract: 06053012700

17.6%
(2021)
Compared to:
Compared to CA Census Tracts, 06053012700 has a value of 17.6% which is in the worst 25% of census tracts. Census tracts in the best 50% have a value lower than 15.9% while census tracts in the worst 25% have a value higher than 17.2%.
CA Census Tracts
The distribution is based on data from 8,005 California census tracts.
Compared to U.S. Census Tracts, 06053012700 has a value of 17.6% which is in the 2nd worst quartile of census tracts. Census tracts in the best 50% have a value lower than 16.5% while census tracts in the worst 25% have a value higher than 18.3%.
U.S. Census Tracts
The distribution is based on data from 68,167 U.S. census tracts.
Compared to the Monterey, CA County Value (14.9%), 06053012700 has a value of 17.6% which is higher and worse.
Monterey, CA County Value
(14.9%)
The regional value is compared to the Monterey County value.
Compared to the US Value (15.5%), 06053012700 has a value of 17.6% which is higher and worse.
US Value
(15.5%)
The regional value is compared to the national value.

Adults who Binge Drink Census Tract: 06053012800

Current Value:

Adults who Binge Drink Census Tract: 06053012800

13.1%
(2021)
Compared to:
Compared to CA Census Tracts, 06053012800 has a value of 13.1% which is in the best 50% of census tracts. Census tracts in the best 50% have a value lower than 15.9% while census tracts in the worst 25% have a value higher than 17.2%.
CA Census Tracts
The distribution is based on data from 8,005 California census tracts.
Compared to U.S. Census Tracts, 06053012800 has a value of 13.1% which is in the best 50% of census tracts. Census tracts in the best 50% have a value lower than 16.5% while census tracts in the worst 25% have a value higher than 18.3%.
U.S. Census Tracts
The distribution is based on data from 68,167 U.S. census tracts.
Compared to the Monterey, CA County Value (14.9%), 06053012800 has a value of 13.1% which is lower and better.
Monterey, CA County Value
(14.9%)
The regional value is compared to the Monterey County value.
Compared to the US Value (15.5%), 06053012800 has a value of 13.1% which is lower and better.
US Value
(15.5%)
The regional value is compared to the national value.

Adults who Binge Drink Census Tract: 06053013000

Current Value:

Adults who Binge Drink Census Tract: 06053013000

17.1%
(2021)
Compared to:
Compared to CA Census Tracts, 06053013000 has a value of 17.1% which is in the 2nd worst quartile of census tracts. Census tracts in the best 50% have a value lower than 15.9% while census tracts in the worst 25% have a value higher than 17.2%.
CA Census Tracts
The distribution is based on data from 8,005 California census tracts.
Compared to U.S. Census Tracts, 06053013000 has a value of 17.1% which is in the 2nd worst quartile of census tracts. Census tracts in the best 50% have a value lower than 16.5% while census tracts in the worst 25% have a value higher than 18.3%.
U.S. Census Tracts
The distribution is based on data from 68,167 U.S. census tracts.
Compared to the Monterey, CA County Value (14.9%), 06053013000 has a value of 17.1% which is higher and worse.
Monterey, CA County Value
(14.9%)
The regional value is compared to the Monterey County value.
Compared to the US Value (15.5%), 06053013000 has a value of 17.1% which is higher and worse.
US Value
(15.5%)
The regional value is compared to the national value.

Adults who Binge Drink Census Tract: 06053013100

Current Value:

Adults who Binge Drink Census Tract: 06053013100

23.2%
(2021)
Compared to:
Compared to CA Census Tracts, 06053013100 has a value of 23.2% which is in the worst 25% of census tracts. Census tracts in the best 50% have a value lower than 15.9% while census tracts in the worst 25% have a value higher than 17.2%.
CA Census Tracts
The distribution is based on data from 8,005 California census tracts.
Compared to U.S. Census Tracts, 06053013100 has a value of 23.2% which is in the worst 25% of census tracts. Census tracts in the best 50% have a value lower than 16.5% while census tracts in the worst 25% have a value higher than 18.3%.
U.S. Census Tracts
The distribution is based on data from 68,167 U.S. census tracts.
Compared to the Monterey, CA County Value (14.9%), 06053013100 has a value of 23.2% which is higher and worse.
Monterey, CA County Value
(14.9%)
The regional value is compared to the Monterey County value.
Compared to the US Value (15.5%), 06053013100 has a value of 23.2% which is higher and worse.
US Value
(15.5%)
The regional value is compared to the national value.

Adults who Binge Drink Census Tract: 06053013200

Current Value:

Adults who Binge Drink Census Tract: 06053013200

13.8%
(2021)
Compared to:
Compared to CA Census Tracts, 06053013200 has a value of 13.8% which is in the best 50% of census tracts. Census tracts in the best 50% have a value lower than 15.9% while census tracts in the worst 25% have a value higher than 17.2%.
CA Census Tracts
The distribution is based on data from 8,005 California census tracts.
Compared to U.S. Census Tracts, 06053013200 has a value of 13.8% which is in the best 50% of census tracts. Census tracts in the best 50% have a value lower than 16.5% while census tracts in the worst 25% have a value higher than 18.3%.
U.S. Census Tracts
The distribution is based on data from 68,167 U.S. census tracts.
Compared to the Monterey, CA County Value (14.9%), 06053013200 has a value of 13.8% which is lower and better.
Monterey, CA County Value
(14.9%)
The regional value is compared to the Monterey County value.
Compared to the US Value (15.5%), 06053013200 has a value of 13.8% which is lower and better.
US Value
(15.5%)
The regional value is compared to the national value.

Adults who Binge Drink Census Tract: 06053013300

Current Value:

Adults who Binge Drink Census Tract: 06053013300

16.2%
(2021)
Compared to:
Compared to CA Census Tracts, 06053013300 has a value of 16.2% which is in the 2nd worst quartile of census tracts. Census tracts in the best 50% have a value lower than 15.9% while census tracts in the worst 25% have a value higher than 17.2%.
CA Census Tracts
The distribution is based on data from 8,005 California census tracts.
Compared to U.S. Census Tracts, 06053013300 has a value of 16.2% which is in the best 50% of census tracts. Census tracts in the best 50% have a value lower than 16.5% while census tracts in the worst 25% have a value higher than 18.3%.
U.S. Census Tracts
The distribution is based on data from 68,167 U.S. census tracts.
Compared to the Monterey, CA County Value (14.9%), 06053013300 has a value of 16.2% which is higher and worse.
Monterey, CA County Value
(14.9%)
The regional value is compared to the Monterey County value.
Compared to the US Value (15.5%), 06053013300 has a value of 16.2% which is higher and worse.
US Value
(15.5%)
The regional value is compared to the national value.

Adults who Binge Drink Census Tract: 06053013400

Current Value:

Adults who Binge Drink Census Tract: 06053013400

15.6%
(2021)
Compared to:
Compared to CA Census Tracts, 06053013400 has a value of 15.6% which is in the best 50% of census tracts. Census tracts in the best 50% have a value lower than 15.9% while census tracts in the worst 25% have a value higher than 17.2%.
CA Census Tracts
The distribution is based on data from 8,005 California census tracts.
Compared to U.S. Census Tracts, 06053013400 has a value of 15.6% which is in the best 50% of census tracts. Census tracts in the best 50% have a value lower than 16.5% while census tracts in the worst 25% have a value higher than 18.3%.
U.S. Census Tracts
The distribution is based on data from 68,167 U.S. census tracts.
Compared to the Monterey, CA County Value (14.9%), 06053013400 has a value of 15.6% which is higher and worse.
Monterey, CA County Value
(14.9%)
The regional value is compared to the Monterey County value.
Compared to the US Value (15.5%), 06053013400 has a value of 15.6% which is higher and worse.
US Value
(15.5%)
The regional value is compared to the national value.

Adults who Binge Drink Census Tract: 06053013500

Current Value:

Adults who Binge Drink Census Tract: 06053013500

14.6%
(2021)
Compared to:
Compared to CA Census Tracts, 06053013500 has a value of 14.6% which is in the best 50% of census tracts. Census tracts in the best 50% have a value lower than 15.9% while census tracts in the worst 25% have a value higher than 17.2%.
CA Census Tracts
The distribution is based on data from 8,005 California census tracts.
Compared to U.S. Census Tracts, 06053013500 has a value of 14.6% which is in the best 50% of census tracts. Census tracts in the best 50% have a value lower than 16.5% while census tracts in the worst 25% have a value higher than 18.3%.
U.S. Census Tracts
The distribution is based on data from 68,167 U.S. census tracts.
Compared to the Monterey, CA County Value (14.9%), 06053013500 has a value of 14.6% which is lower and better.
Monterey, CA County Value
(14.9%)
The regional value is compared to the Monterey County value.
Compared to the US Value (15.5%), 06053013500 has a value of 14.6% which is lower and better.
US Value
(15.5%)
The regional value is compared to the national value.

Adults who Binge Drink Census Tract: 06053013600

Current Value:

Adults who Binge Drink Census Tract: 06053013600

15.3%
(2021)
Compared to:
Compared to CA Census Tracts, 06053013600 has a value of 15.3% which is in the best 50% of census tracts. Census tracts in the best 50% have a value lower than 15.9% while census tracts in the worst 25% have a value higher than 17.2%.
CA Census Tracts
The distribution is based on data from 8,005 California census tracts.
Compared to U.S. Census Tracts, 06053013600 has a value of 15.3% which is in the best 50% of census tracts. Census tracts in the best 50% have a value lower than 16.5% while census tracts in the worst 25% have a value higher than 18.3%.
U.S. Census Tracts
The distribution is based on data from 68,167 U.S. census tracts.
Compared to the Monterey, CA County Value (14.9%), 06053013600 has a value of 15.3% which is higher and worse.
Monterey, CA County Value
(14.9%)
The regional value is compared to the Monterey County value.
Compared to the US Value (15.5%), 06053013600 has a value of 15.3% which is lower and better.
US Value
(15.5%)
The regional value is compared to the national value.

Adults who Binge Drink Census Tract: 06053013700

Current Value:

Adults who Binge Drink Census Tract: 06053013700

16.1%
(2021)
Compared to:
Compared to CA Census Tracts, 06053013700 has a value of 16.1% which is in the 2nd worst quartile of census tracts. Census tracts in the best 50% have a value lower than 15.9% while census tracts in the worst 25% have a value higher than 17.2%.
CA Census Tracts
The distribution is based on data from 8,005 California census tracts.
Compared to U.S. Census Tracts, 06053013700 has a value of 16.1% which is in the best 50% of census tracts. Census tracts in the best 50% have a value lower than 16.5% while census tracts in the worst 25% have a value higher than 18.3%.
U.S. Census Tracts
The distribution is based on data from 68,167 U.S. census tracts.
Compared to the Monterey, CA County Value (14.9%), 06053013700 has a value of 16.1% which is higher and worse.
Monterey, CA County Value
(14.9%)
The regional value is compared to the Monterey County value.
Compared to the US Value (15.5%), 06053013700 has a value of 16.1% which is higher and worse.
US Value
(15.5%)
The regional value is compared to the national value.

Adults who Binge Drink Census Tract: 06053013800

Current Value:

Adults who Binge Drink Census Tract: 06053013800

14.8%
(2021)
Compared to:
Compared to CA Census Tracts, 06053013800 has a value of 14.8% which is in the best 50% of census tracts. Census tracts in the best 50% have a value lower than 15.9% while census tracts in the worst 25% have a value higher than 17.2%.
CA Census Tracts
The distribution is based on data from 8,005 California census tracts.
Compared to U.S. Census Tracts, 06053013800 has a value of 14.8% which is in the best 50% of census tracts. Census tracts in the best 50% have a value lower than 16.5% while census tracts in the worst 25% have a value higher than 18.3%.
U.S. Census Tracts
The distribution is based on data from 68,167 U.S. census tracts.
Compared to the Monterey, CA County Value (14.9%), 06053013800 has a value of 14.8% which is lower and better.
Monterey, CA County Value
(14.9%)
The regional value is compared to the Monterey County value.
Compared to the US Value (15.5%), 06053013800 has a value of 14.8% which is lower and better.
US Value
(15.5%)
The regional value is compared to the national value.

Adults who Binge Drink Census Tract: 06053013900

Current Value:

Adults who Binge Drink Census Tract: 06053013900

15.3%
(2021)
Compared to:
Compared to CA Census Tracts, 06053013900 has a value of 15.3% which is in the best 50% of census tracts. Census tracts in the best 50% have a value lower than 15.9% while census tracts in the worst 25% have a value higher than 17.2%.
CA Census Tracts
The distribution is based on data from 8,005 California census tracts.
Compared to U.S. Census Tracts, 06053013900 has a value of 15.3% which is in the best 50% of census tracts. Census tracts in the best 50% have a value lower than 16.5% while census tracts in the worst 25% have a value higher than 18.3%.
U.S. Census Tracts
The distribution is based on data from 68,167 U.S. census tracts.
Compared to the Monterey, CA County Value (14.9%), 06053013900 has a value of 15.3% which is higher and worse.
Monterey, CA County Value
(14.9%)
The regional value is compared to the Monterey County value.
Compared to the US Value (15.5%), 06053013900 has a value of 15.3% which is lower and better.
US Value
(15.5%)
The regional value is compared to the national value.

Adults who Binge Drink Census Tract: 06053014000

Current Value:

Adults who Binge Drink Census Tract: 06053014000

16.1%
(2021)
Compared to:
Compared to CA Census Tracts, 06053014000 has a value of 16.1% which is in the 2nd worst quartile of census tracts. Census tracts in the best 50% have a value lower than 15.9% while census tracts in the worst 25% have a value higher than 17.2%.
CA Census Tracts
The distribution is based on data from 8,005 California census tracts.
Compared to U.S. Census Tracts, 06053014000 has a value of 16.1% which is in the best 50% of census tracts. Census tracts in the best 50% have a value lower than 16.5% while census tracts in the worst 25% have a value higher than 18.3%.
U.S. Census Tracts
The distribution is based on data from 68,167 U.S. census tracts.
Compared to the Monterey, CA County Value (14.9%), 06053014000 has a value of 16.1% which is higher and worse.
Monterey, CA County Value
(14.9%)
The regional value is compared to the Monterey County value.
Compared to the US Value (15.5%), 06053014000 has a value of 16.1% which is higher and worse.
US Value
(15.5%)
The regional value is compared to the national value.

Adults who Binge Drink Census Tract: 06053014102

Current Value:

Adults who Binge Drink Census Tract: 06053014102

16.0%
(2021)
Compared to:
Compared to CA Census Tracts, 06053014102 has a value of 16.0% which is in the 2nd worst quartile of census tracts. Census tracts in the best 50% have a value lower than 15.9% while census tracts in the worst 25% have a value higher than 17.2%.
CA Census Tracts
The distribution is based on data from 8,005 California census tracts.
Compared to U.S. Census Tracts, 06053014102 has a value of 16.0% which is in the best 50% of census tracts. Census tracts in the best 50% have a value lower than 16.5% while census tracts in the worst 25% have a value higher than 18.3%.
U.S. Census Tracts
The distribution is based on data from 68,167 U.S. census tracts.
Compared to the Monterey, CA County Value (14.9%), 06053014102 has a value of 16.0% which is higher and worse.
Monterey, CA County Value
(14.9%)
The regional value is compared to the Monterey County value.
Compared to the US Value (15.5%), 06053014102 has a value of 16.0% which is higher and worse.
US Value
(15.5%)
The regional value is compared to the national value.

Adults who Binge Drink Census Tract: 06053014104

Current Value:

Adults who Binge Drink Census Tract: 06053014104

19.7%
(2021)
Compared to:
Compared to CA Census Tracts, 06053014104 has a value of 19.7% which is in the worst 25% of census tracts. Census tracts in the best 50% have a value lower than 15.9% while census tracts in the worst 25% have a value higher than 17.2%.
CA Census Tracts
The distribution is based on data from 8,005 California census tracts.
Compared to U.S. Census Tracts, 06053014104 has a value of 19.7% which is in the worst 25% of census tracts. Census tracts in the best 50% have a value lower than 16.5% while census tracts in the worst 25% have a value higher than 18.3%.
U.S. Census Tracts
The distribution is based on data from 68,167 U.S. census tracts.
Compared to the Monterey, CA County Value (14.9%), 06053014104 has a value of 19.7% which is higher and worse.
Monterey, CA County Value
(14.9%)
The regional value is compared to the Monterey County value.
Compared to the US Value (15.5%), 06053014104 has a value of 19.7% which is higher and worse.
US Value
(15.5%)
The regional value is compared to the national value.

Adults who Binge Drink Census Tract: 06053014105

Current Value:

Adults who Binge Drink Census Tract: 06053014105

18.6%
(2021)
Compared to:
Compared to CA Census Tracts, 06053014105 has a value of 18.6% which is in the worst 25% of census tracts. Census tracts in the best 50% have a value lower than 15.9% while census tracts in the worst 25% have a value higher than 17.2%.
CA Census Tracts
The distribution is based on data from 8,005 California census tracts.
Compared to U.S. Census Tracts, 06053014105 has a value of 18.6% which is in the worst 25% of census tracts. Census tracts in the best 50% have a value lower than 16.5% while census tracts in the worst 25% have a value higher than 18.3%.
U.S. Census Tracts
The distribution is based on data from 68,167 U.S. census tracts.
Compared to the Monterey, CA County Value (14.9%), 06053014105 has a value of 18.6% which is higher and worse.
Monterey, CA County Value
(14.9%)
The regional value is compared to the Monterey County value.
Compared to the US Value (15.5%), 06053014105 has a value of 18.6% which is higher and worse.
US Value
(15.5%)
The regional value is compared to the national value.

Adults who Binge Drink Census Tract: 06053014107

Current Value:

Adults who Binge Drink Census Tract: 06053014107

20.2%
(2021)
Compared to:
Compared to CA Census Tracts, 06053014107 has a value of 20.2% which is in the worst 25% of census tracts. Census tracts in the best 50% have a value lower than 15.9% while census tracts in the worst 25% have a value higher than 17.2%.
CA Census Tracts
The distribution is based on data from 8,005 California census tracts.
Compared to U.S. Census Tracts, 06053014107 has a value of 20.2% which is in the worst 25% of census tracts. Census tracts in the best 50% have a value lower than 16.5% while census tracts in the worst 25% have a value higher than 18.3%.
U.S. Census Tracts
The distribution is based on data from 68,167 U.S. census tracts.
Compared to the Monterey, CA County Value (14.9%), 06053014107 has a value of 20.2% which is higher and worse.
Monterey, CA County Value
(14.9%)
The regional value is compared to the Monterey County value.
Compared to the US Value (15.5%), 06053014107 has a value of 20.2% which is higher and worse.
US Value
(15.5%)
The regional value is compared to the national value.

Adults who Binge Drink Census Tract: 06053014201

Current Value:

Adults who Binge Drink Census Tract: 06053014201

14.7%
(2021)
Compared to:
Compared to CA Census Tracts, 06053014201 has a value of 14.7% which is in the best 50% of census tracts. Census tracts in the best 50% have a value lower than 15.9% while census tracts in the worst 25% have a value higher than 17.2%.
CA Census Tracts
The distribution is based on data from 8,005 California census tracts.
Compared to U.S. Census Tracts, 06053014201 has a value of 14.7% which is in the best 50% of census tracts. Census tracts in the best 50% have a value lower than 16.5% while census tracts in the worst 25% have a value higher than 18.3%.
U.S. Census Tracts
The distribution is based on data from 68,167 U.S. census tracts.
Compared to the Monterey, CA County Value (14.9%), 06053014201 has a value of 14.7% which is lower and better.
Monterey, CA County Value
(14.9%)
The regional value is compared to the Monterey County value.
Compared to the US Value (15.5%), 06053014201 has a value of 14.7% which is lower and better.
US Value
(15.5%)
The regional value is compared to the national value.

Adults who Binge Drink Census Tract: 06053014202

Current Value:

Adults who Binge Drink Census Tract: 06053014202

13.1%
(2021)
Compared to:
Compared to CA Census Tracts, 06053014202 has a value of 13.1% which is in the best 50% of census tracts. Census tracts in the best 50% have a value lower than 15.9% while census tracts in the worst 25% have a value higher than 17.2%.
CA Census Tracts
The distribution is based on data from 8,005 California census tracts.
Compared to U.S. Census Tracts, 06053014202 has a value of 13.1% which is in the best 50% of census tracts. Census tracts in the best 50% have a value lower than 16.5% while census tracts in the worst 25% have a value higher than 18.3%.
U.S. Census Tracts
The distribution is based on data from 68,167 U.S. census tracts.
Compared to the Monterey, CA County Value (14.9%), 06053014202 has a value of 13.1% which is lower and better.
Monterey, CA County Value
(14.9%)
The regional value is compared to the Monterey County value.
Compared to the US Value (15.5%), 06053014202 has a value of 13.1% which is lower and better.
US Value
(15.5%)
The regional value is compared to the national value.

Adults who Binge Drink Census Tract: 06053014301

Current Value:

Adults who Binge Drink Census Tract: 06053014301

15.7%
(2021)
Compared to:
Compared to CA Census Tracts, 06053014301 has a value of 15.7% which is in the best 50% of census tracts. Census tracts in the best 50% have a value lower than 15.9% while census tracts in the worst 25% have a value higher than 17.2%.
CA Census Tracts
The distribution is based on data from 8,005 California census tracts.
Compared to U.S. Census Tracts, 06053014301 has a value of 15.7% which is in the best 50% of census tracts. Census tracts in the best 50% have a value lower than 16.5% while census tracts in the worst 25% have a value higher than 18.3%.
U.S. Census Tracts
The distribution is based on data from 68,167 U.S. census tracts.
Compared to the Monterey, CA County Value (14.9%), 06053014301 has a value of 15.7% which is higher and worse.
Monterey, CA County Value
(14.9%)
The regional value is compared to the Monterey County value.
Compared to the US Value (15.5%), 06053014301 has a value of 15.7% which is higher and worse.
US Value
(15.5%)
The regional value is compared to the national value.

Adults who Binge Drink Census Tract: 06053014302

Current Value:

Adults who Binge Drink Census Tract: 06053014302

14.8%
(2021)
Compared to:
Compared to CA Census Tracts, 06053014302 has a value of 14.8% which is in the best 50% of census tracts. Census tracts in the best 50% have a value lower than 15.9% while census tracts in the worst 25% have a value higher than 17.2%.
CA Census Tracts
The distribution is based on data from 8,005 California census tracts.
Compared to U.S. Census Tracts, 06053014302 has a value of 14.8% which is in the best 50% of census tracts. Census tracts in the best 50% have a value lower than 16.5% while census tracts in the worst 25% have a value higher than 18.3%.
U.S. Census Tracts
The distribution is based on data from 68,167 U.S. census tracts.
Compared to the Monterey, CA County Value (14.9%), 06053014302 has a value of 14.8% which is lower and better.
Monterey, CA County Value
(14.9%)
The regional value is compared to the Monterey County value.
Compared to the US Value (15.5%), 06053014302 has a value of 14.8% which is lower and better.
US Value
(15.5%)
The regional value is compared to the national value.

Adults who Binge Drink Census Tract: 06053014500

Current Value:

Adults who Binge Drink Census Tract: 06053014500

14.0%
(2021)
Compared to:
Compared to CA Census Tracts, 06053014500 has a value of 14.0% which is in the best 50% of census tracts. Census tracts in the best 50% have a value lower than 15.9% while census tracts in the worst 25% have a value higher than 17.2%.
CA Census Tracts
The distribution is based on data from 8,005 California census tracts.
Compared to U.S. Census Tracts, 06053014500 has a value of 14.0% which is in the best 50% of census tracts. Census tracts in the best 50% have a value lower than 16.5% while census tracts in the worst 25% have a value higher than 18.3%.
U.S. Census Tracts
The distribution is based on data from 68,167 U.S. census tracts.
Compared to the Monterey, CA County Value (14.9%), 06053014500 has a value of 14.0% which is lower and better.
Monterey, CA County Value
(14.9%)
The regional value is compared to the Monterey County value.
Compared to the US Value (15.5%), 06053014500 has a value of 14.0% which is lower and better.
US Value
(15.5%)
The regional value is compared to the national value.

Adults who Binge Drink Census Tract: 06053014601

Current Value:

Adults who Binge Drink Census Tract: 06053014601

16.7%
(2021)
Compared to:
Compared to CA Census Tracts, 06053014601 has a value of 16.7% which is in the 2nd worst quartile of census tracts. Census tracts in the best 50% have a value lower than 15.9% while census tracts in the worst 25% have a value higher than 17.2%.
CA Census Tracts
The distribution is based on data from 8,005 California census tracts.
Compared to U.S. Census Tracts, 06053014601 has a value of 16.7% which is in the 2nd worst quartile of census tracts. Census tracts in the best 50% have a value lower than 16.5% while census tracts in the worst 25% have a value higher than 18.3%.
U.S. Census Tracts
The distribution is based on data from 68,167 U.S. census tracts.
Compared to the Monterey, CA County Value (14.9%), 06053014601 has a value of 16.7% which is higher and worse.
Monterey, CA County Value
(14.9%)
The regional value is compared to the Monterey County value.
Compared to the US Value (15.5%), 06053014601 has a value of 16.7% which is higher and worse.
US Value
(15.5%)
The regional value is compared to the national value.

Adults who Binge Drink Census Tract: 06053014700

Current Value:

Adults who Binge Drink Census Tract: 06053014700

15.7%
(2021)
Compared to:
Compared to CA Census Tracts, 06053014700 has a value of 15.7% which is in the best 50% of census tracts. Census tracts in the best 50% have a value lower than 15.9% while census tracts in the worst 25% have a value higher than 17.2%.
CA Census Tracts
The distribution is based on data from 8,005 California census tracts.
Compared to U.S. Census Tracts, 06053014700 has a value of 15.7% which is in the best 50% of census tracts. Census tracts in the best 50% have a value lower than 16.5% while census tracts in the worst 25% have a value higher than 18.3%.
U.S. Census Tracts
The distribution is based on data from 68,167 U.S. census tracts.
Compared to the Monterey, CA County Value (14.9%), 06053014700 has a value of 15.7% which is higher and worse.
Monterey, CA County Value
(14.9%)
The regional value is compared to the Monterey County value.
Compared to the US Value (15.5%), 06053014700 has a value of 15.7% which is higher and worse.
US Value
(15.5%)
The regional value is compared to the national value.