
Advanced Search: Build a Custom Dashboard
In the fields below, search for indicators by location, topics, population, classification, subgroup, or comparison. No fields are required, but we suggest selecting a location or two to start. In the additional search options section, select options to group and order search results. To learn more about how to customize a dashboard, see our help center.
Visit the Indicator List Page to see the full list of indicators and locations available on the site.
Search Results:
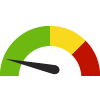
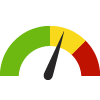
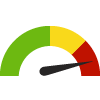
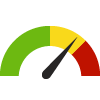
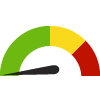
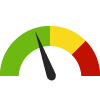
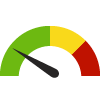
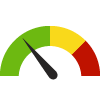
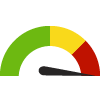
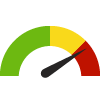
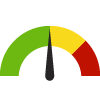
Indicator Gauge Icon Legend
Legend Colors
Red is bad, green is good, blue is not statistically different/neutral.
Compared to Distribution
 the value is in the best half of communities.
 the value is in the 2nd worst quarter of communities.
 the value is in the worst quarter of communities.
Compared to Target
 meets target;
  does not meet target.
Compared to a Single Value
 lower than the comparison value;
 higher than the comparison value;
 not statistically different from comparison value.
Trend

 non-significant change over time;
 significant change over time;
  no change over time.
Compared to Prior Value
 higher than the previous measurement period;
 lower than the previous measurement period;
 no statistically different change from previous measurement period.
Health / Alcohol & Drug Use
Adults who Binge Drink Census Tract: 06053014800
Adults who Binge Drink Census Tract: 06053014800
16.9%
(2021)
Compared to:

CA Census Tracts
The distribution is based on data from 8,005 California census tracts.
U.S. Census Tracts
The distribution is based on data from 68,167 U.S. census tracts.
Monterey, CA County Value
(14.9%)
The regional value is compared to the Monterey County value.
US Value
(15.5%)
The regional value is compared to the national value.
Adults who Binge Drink Census Tract: 06053980000
Adults who Binge Drink Census Tract: 06053980000
0.0%
(2015)
Compared to:
CA Census Tracts
(2021)
The distribution is based on data from 8,005 California census tracts.
U.S. Census Tracts
(2021)
The distribution is based on data from 68,167 U.S. census tracts.
Monterey, CA County Value
(14.9% in 2021)
The regional value is compared to the Monterey County value.
US Value
(16.3%)
The regional value is compared to the national value.
Age-Adjusted Death Rate due to All Opioid Overdose County: Monterey
Age-Adjusted Death Rate due to All Opioid Overdose County: Monterey
6.8
Rate per 100,000 residents
(2022)
Compared to:


CA Counties
The distribution is based on data from 58 California counties.
CA Value
(18.7)
The regional value is compared to the California state value.
Prior Value
(5.6)
Prior Value compares a measured value with the previously measured value. Confidence intervals were not taken into account in determining the direction of the comparison.
Trend
This comparison measures the indicator’s values over multiple time periods.<br>The Mann-Kendall Test for Statistical Significance is used to evaluate the trend<br>over 4 to 10 periods of measure, subject to data availability and comparability.
Age-Adjusted Death Rate due to All Opioid Overdose State: California
Age-Adjusted Death Rate due to All Opioid Overdose State: California
18.7
Rate per 100,000 residents
(2022)
Compared to:

Prior Value
(18.0)
Prior Value compares a measured value with the previously measured value. Confidence intervals were not taken into account in determining the direction of the comparison.
Trend
This comparison measures the indicator’s values over multiple time periods.<br>The Mann-Kendall Test for Statistical Significance is used to evaluate the trend<br>over 4 to 10 periods of measure, subject to data availability and comparability.
Age-Adjusted Death Rate due to Drug Use County: Monterey
Age-Adjusted Death Rate due to Drug Use County: Monterey
19.0
Deaths per 100,000 population
(2019-2021)
Compared to:
CA Counties
The distribution is based on data from 57 California counties.
CA Value
(21.4)
The regional value is compared to the California state value.
Prior Value
(16.6)
Prior Value compares a measured value with the previously measured value. Confidence intervals were taken into account in determining the direction of the comparison.
Trend
This comparison measures the indicator’s values over multiple time periods.<br>The Mann-Kendall Test for Statistical Significance is used to evaluate the trend<br>over 4 to 10 periods of measure, subject to data availability and comparability.
Age-Adjusted Death Rate due to Drug Use State: California
Age-Adjusted Death Rate due to Drug Use State: California
21.4
Deaths per 100,000 population
(2019-2021)
Compared to:
Prior Value
(17.8)
Prior Value compares a measured value with the previously measured value. Confidence intervals were taken into account in determining the direction of the comparison.
Trend
This comparison measures the indicator’s values over multiple time periods.<br>The Mann-Kendall Test for Statistical Significance is used to evaluate the trend<br>over 4 to 10 periods of measure, subject to data availability and comparability.
Age-Adjusted Death Rate due to Fentanyl Overdose County: Monterey
Age-Adjusted Death Rate due to Fentanyl Overdose County: Monterey
7.0
(2022)
Compared to:
CA Counties
The distribution is based on data from 58 California counties.
CA Value
(16.6)
The regional value is compared to the California state value.
Prior Value
(3.7)
Prior Value compares a measured value with the previously measured value. Confidence intervals were not taken into account in determining the direction of the comparison.
Trend
This comparison measures the indicator’s values over multiple time periods.<br>The Mann-Kendall Test for Statistical Significance is used to evaluate the trend<br>over 4 to 10 periods of measure, subject to data availability and comparability.
Age-Adjusted Death Rate due to Fentanyl Overdose State: California
Age-Adjusted Death Rate due to Fentanyl Overdose State: California
16.6
(2022)
Compared to:
Prior Value
(15.3)
Prior Value compares a measured value with the previously measured value. Confidence intervals were not taken into account in determining the direction of the comparison.
Trend
This comparison measures the indicator’s values over multiple time periods.<br>The Mann-Kendall Test for Statistical Significance is used to evaluate the trend<br>over 4 to 10 periods of measure, subject to data availability and comparability.
Age-Adjusted Death Rate due to Heroin Overdose County: Monterey
Age-Adjusted Death Rate due to Heroin Overdose County: Monterey
0.6
Deaths per 100,000 population
(2018)
Compared to:
CA Counties
The distribution is based on data from 58 California counties.
CA Value
(1.9)
The regional value is compared to the California state value.
Prior Value
(0.4)
Prior Value compares a measured value with the previously measured value. Confidence intervals were not taken into account in determining the direction of the comparison.
Trend
This comparison measures the indicator’s values over multiple time periods.<br>The Mann-Kendall Test for Statistical Significance is used to evaluate the trend<br>over 4 to 10 periods of measure, subject to data availability and comparability.
HP 2030 Target
(4.2)
Age-Adjusted Death Rate due to Heroin Overdose State: California
Age-Adjusted Death Rate due to Heroin Overdose State: California
1.2
Deaths per 100,000 population
(2022)
Compared to:
Prior Value
(1.9)
Prior Value compares a measured value with the previously measured value. Confidence intervals were not taken into account in determining the direction of the comparison.
Trend
This comparison measures the indicator’s values over multiple time periods.<br>The Mann-Kendall Test for Statistical Significance is used to evaluate the trend<br>over 4 to 10 periods of measure, subject to data availability and comparability.
HP 2030 Target
(4.2)
Health / Alcohol & Drug Use
Age-Adjusted Death Rate due to Prescription Opioid Overdose
Value
Compared to:
Age-Adjusted Death Rate due to Prescription Opioid Overdose County: Monterey
Age-Adjusted Death Rate due to Prescription Opioid Overdose County: Monterey
6.3
Rate per 100,000 residents
(2022)
Compared to:
CA Counties
The distribution is based on data from 58 California counties.
CA Value
(18.1)
The regional value is compared to the California state value.
Prior Value
(4.6)
Prior Value compares a measured value with the previously measured value. Confidence intervals were not taken into account in determining the direction of the comparison.
Trend
This comparison measures the indicator’s values over multiple time periods.<br>The Mann-Kendall Test for Statistical Significance is used to evaluate the trend<br>over 4 to 10 periods of measure, subject to data availability and comparability.
Age-Adjusted Death Rate due to Prescription Opioid Overdose State: California
Age-Adjusted Death Rate due to Prescription Opioid Overdose State: California
18.1
Rate per 100,000 residents
(2022)
Compared to:
Prior Value
(17.0)
Prior Value compares a measured value with the previously measured value. Confidence intervals were not taken into account in determining the direction of the comparison.
Trend
This comparison measures the indicator’s values over multiple time periods.<br>The Mann-Kendall Test for Statistical Significance is used to evaluate the trend<br>over 4 to 10 periods of measure, subject to data availability and comparability.
Health / Alcohol & Drug Use
Age-Adjusted Death Rate due to Synthetic Opioid Overdose (excluding Methadone)
Value
Compared to:
Age-Adjusted Death Rate due to Synthetic Opioid Overdose (excluding Methadone) County: Monterey
Age-Adjusted Death Rate due to Synthetic Opioid Overdose (excluding Methadone) County: Monterey
5.6
Rate per 100,000 residents
(2022)
Compared to:
CA Counties
The distribution is based on data from 58 California counties.
CA Value
(16.7)
The regional value is compared to the California state value.
Prior Value
(3.6)
Prior Value compares a measured value with the previously measured value. Confidence intervals were not taken into account in determining the direction of the comparison.
Trend
This comparison measures the indicator’s values over multiple time periods.<br>The Mann-Kendall Test for Statistical Significance is used to evaluate the trend<br>over 4 to 10 periods of measure, subject to data availability and comparability.
HP 2030 Target
(8.9)
<div>IVP-22: Reduce overdose deaths involving synthetic opioids other than methadone</div>
Age-Adjusted Death Rate due to Synthetic Opioid Overdose (excluding Methadone) State: California
Age-Adjusted Death Rate due to Synthetic Opioid Overdose (excluding Methadone) State: California
16.7
Rate per 100,000 residents
(2022)
Compared to:
Prior Value
(15.5)
Prior Value compares a measured value with the previously measured value. Confidence intervals were not taken into account in determining the direction of the comparison.
Trend
This comparison measures the indicator’s values over multiple time periods.<br>The Mann-Kendall Test for Statistical Significance is used to evaluate the trend<br>over 4 to 10 periods of measure, subject to data availability and comparability.
HP 2030 Target
(8.9)
<div>IVP-22: Reduce overdose deaths involving synthetic opioids other than methadone</div>
Health / Alcohol & Drug Use
Age-Adjusted Drug and Opioid-Involved Overdose Death Rate
Value
Compared to:
Age-Adjusted Drug and Opioid-Involved Overdose Death Rate County: Monterey
Age-Adjusted Drug and Opioid-Involved Overdose Death Rate County: Monterey
16.0
Deaths per 100,000 population
(2018-2020)
Compared to:
CA Counties
The distribution is based on data from 48 California counties.
U.S. Counties
The distribution is based on data from 1,303 U.S. counties and county equivalents.
CA Value
(16.5)
The regional value is compared to the California state value.
US Value
(23.5)
The regional value is compared to the national value.
Prior Value
(12.7)
Prior Value compares a measured value with the previously measured value. Confidence intervals were taken into account in determining the direction of the comparison.
Age-Adjusted Drug and Opioid-Involved Overdose Death Rate State: California
Age-Adjusted Drug and Opioid-Involved Overdose Death Rate State: California
16.5
Deaths per 100,000 population
(2018-2020)
Compared to:
U.S. States
The distribution is based on data from 50 U.S. states and the District of Columbia.
US Value
(23.5)
The regional value is compared to the national value.
Prior Value
(15.0)
Prior Value compares a measured value with the previously measured value. Confidence intervals were taken into account in determining the direction of the comparison.
Age-Adjusted ED Visit Rate due to All Drug Overdose County: Monterey
Age-Adjusted ED Visit Rate due to All Drug Overdose County: Monterey
115.0
Rate per 100,000 residents
(2022)
Compared to:
CA Counties
The distribution is based on data from 58 California counties.
CA Value
(143.7)
The regional value is compared to the California state value.
Prior Value
(118.9)
Prior Value compares a measured value with the previously measured value. Confidence intervals were not taken into account in determining the direction of the comparison.
Trend
This comparison measures the indicator’s values over multiple time periods.<br>The Mann-Kendall Test for Statistical Significance is used to evaluate the trend<br>over 4 to 10 periods of measure, subject to data availability and comparability.
Age-Adjusted ED Visit Rate due to All Drug Overdose State: California
Age-Adjusted ED Visit Rate due to All Drug Overdose State: California
143.7
Rate per 100,000 residents
(2022)
Compared to:
Prior Value
(148.2)
Prior Value compares a measured value with the previously measured value. Confidence intervals were not taken into account in determining the direction of the comparison.
Trend
This comparison measures the indicator’s values over multiple time periods.<br>The Mann-Kendall Test for Statistical Significance is used to evaluate the trend<br>over 4 to 10 periods of measure, subject to data availability and comparability.
Age-Adjusted ED Visit Rate due to Heroin Overdose County: Monterey
Age-Adjusted ED Visit Rate due to Heroin Overdose County: Monterey
7.2
Rate per 100,000 residents
(2022)
Compared to:
CA Counties
The distribution is based on data from 58 California counties.
CA Value
(3.6)
The regional value is compared to the California state value.
Prior Value
(8.8)
Prior Value compares a measured value with the previously measured value. Confidence intervals were not taken into account in determining the direction of the comparison.
Trend
This comparison measures the indicator’s values over multiple time periods.<br>The Mann-Kendall Test for Statistical Significance is used to evaluate the trend<br>over 4 to 10 periods of measure, subject to data availability and comparability.
Age-Adjusted ED Visit Rate due to Heroin Overdose State: California
Age-Adjusted ED Visit Rate due to Heroin Overdose State: California
3.6
Rate per 100,000 residents
(2022)
Compared to:
Prior Value
(1.4)
Prior Value compares a measured value with the previously measured value. Confidence intervals were not taken into account in determining the direction of the comparison.
Trend
This comparison measures the indicator’s values over multiple time periods.<br>The Mann-Kendall Test for Statistical Significance is used to evaluate the trend<br>over 4 to 10 periods of measure, subject to data availability and comparability.
Health / Alcohol & Drug Use
Age-Adjusted ED Visit Rate due to Opioid Overdose (excluding Heroin)
Value
Compared to:
Age-Adjusted ED Visit Rate due to Opioid Overdose (excluding Heroin) County: Monterey
Age-Adjusted ED Visit Rate due to Opioid Overdose (excluding Heroin) County: Monterey
42.2
Rate per 100,000 residents
(2022)
Compared to:
CA Counties
The distribution is based on data from 58 California counties.
CA Value
(54.9)
The regional value is compared to the California state value.
Prior Value
(9.7)
Prior Value compares a measured value with the previously measured value. Confidence intervals were not taken into account in determining the direction of the comparison.
Trend
This comparison measures the indicator’s values over multiple time periods.<br>The Mann-Kendall Test for Statistical Significance is used to evaluate the trend<br>over 4 to 10 periods of measure, subject to data availability and comparability.
Age-Adjusted ED Visit Rate due to Opioid Overdose (excluding Heroin) State: California
Age-Adjusted ED Visit Rate due to Opioid Overdose (excluding Heroin) State: California
54.9
Rate per 100,000 residents
(2022)
Compared to:
Prior Value
(10.9)
Prior Value compares a measured value with the previously measured value. Confidence intervals were not taken into account in determining the direction of the comparison.
Trend
This comparison measures the indicator’s values over multiple time periods.<br>The Mann-Kendall Test for Statistical Significance is used to evaluate the trend<br>over 4 to 10 periods of measure, subject to data availability and comparability.
Health / Alcohol & Drug Use
Age-Adjusted Hospitalization Rate due to All Drug Overdose
Value
Compared to:
Age-Adjusted Hospitalization Rate due to All Drug Overdose County: Monterey
Age-Adjusted Hospitalization Rate due to All Drug Overdose County: Monterey
32.2
Rate per 100,000 residents
(2022)
Compared to:
CA Counties
The distribution is based on data from 58 California counties.
CA Value
(48.3)
The regional value is compared to the California state value.
Prior Value
(43.8)
Prior Value compares a measured value with the previously measured value. Confidence intervals were not taken into account in determining the direction of the comparison.
Trend
This comparison measures the indicator’s values over multiple time periods.<br>The Mann-Kendall Test for Statistical Significance is used to evaluate the trend<br>over 4 to 10 periods of measure, subject to data availability and comparability.
Age-Adjusted Hospitalization Rate due to All Drug Overdose State: California
Age-Adjusted Hospitalization Rate due to All Drug Overdose State: California
48.3
Rate per 100,000 residents
(2022)
Compared to:
Prior Value
(52.1)
Prior Value compares a measured value with the previously measured value. Confidence intervals were not taken into account in determining the direction of the comparison.
Trend
This comparison measures the indicator’s values over multiple time periods.<br>The Mann-Kendall Test for Statistical Significance is used to evaluate the trend<br>over 4 to 10 periods of measure, subject to data availability and comparability.
Health / Alcohol & Drug Use
Age-Adjusted Hospitalization Rate due to Heroin Overdose
Value
Compared to:
Age-Adjusted Hospitalization Rate due to Heroin Overdose County: Monterey
Age-Adjusted Hospitalization Rate due to Heroin Overdose County: Monterey
1.4
Rate per 100,000 residents
(2022)
Compared to:
CA Counties
The distribution is based on data from 58 California counties.
CA Value
(0.7)
The regional value is compared to the California state value.
Prior Value
(1.6)
Prior Value compares a measured value with the previously measured value. Confidence intervals were not taken into account in determining the direction of the comparison.
Trend
This comparison measures the indicator’s values over multiple time periods.<br>The Mann-Kendall Test for Statistical Significance is used to evaluate the trend<br>over 4 to 10 periods of measure, subject to data availability and comparability.
Age-Adjusted Hospitalization Rate due to Heroin Overdose State: California
Age-Adjusted Hospitalization Rate due to Heroin Overdose State: California
0.7
Rate per 100,000 residents
(2022)
Compared to:
Prior Value
(1.4)
Prior Value compares a measured value with the previously measured value. Confidence intervals were not taken into account in determining the direction of the comparison.
Trend
This comparison measures the indicator’s values over multiple time periods.<br>The Mann-Kendall Test for Statistical Significance is used to evaluate the trend<br>over 4 to 10 periods of measure, subject to data availability and comparability.
Health / Alcohol & Drug Use
Age-Adjusted Hospitalization Rate due to Opioid Overdose (excluding Heroin)
Value
Compared to:
Age-Adjusted Hospitalization Rate due to Opioid Overdose (excluding Heroin) County: Monterey
Age-Adjusted Hospitalization Rate due to Opioid Overdose (excluding Heroin) County: Monterey
6.7
Rate per 100,000 residents
(2022)
Compared to:
CA Counties
The distribution is based on data from 58 California counties.
CA Value
(12.1)
The regional value is compared to the California state value.
Prior Value
(9.7)
Prior Value compares a measured value with the previously measured value. Confidence intervals were not taken into account in determining the direction of the comparison.
Trend
This comparison measures the indicator’s values over multiple time periods.<br>The Mann-Kendall Test for Statistical Significance is used to evaluate the trend<br>over 4 to 10 periods of measure, subject to data availability and comparability.
Age-Adjusted Hospitalization Rate due to Opioid Overdose (excluding Heroin) State: California
Age-Adjusted Hospitalization Rate due to Opioid Overdose (excluding Heroin) State: California
12.1
Rate per 100,000 residents
(2022)
Compared to:
Prior Value
(10.9)
Prior Value compares a measured value with the previously measured value. Confidence intervals were not taken into account in determining the direction of the comparison.
Trend
This comparison measures the indicator’s values over multiple time periods.<br>The Mann-Kendall Test for Statistical Significance is used to evaluate the trend<br>over 4 to 10 periods of measure, subject to data availability and comparability.
Health / Alcohol & Drug Use
Age-Adjusted Long Acting or Extended Release Opioid Prescription Rate to Opioid Naive Residents
Value
Compared to:
Age-Adjusted Long Acting or Extended Release Opioid Prescription Rate to Opioid Naive Residents County: Monterey
Age-Adjusted Long Acting or Extended Release Opioid Prescription Rate to Opioid Naive Residents County: Monterey
1.1
Per 100,000 population
(2022)
Compared to:
CA Counties
The distribution is based on data from 58 California counties.
CA Value
(1.2)
The regional value is compared to the California state value.
Prior Value
(1.4)
Prior Value compares a measured value with the previously measured value. Confidence intervals were taken into account in determining the direction of the comparison.
Trend
This comparison measures the indicator’s values over multiple time periods.<br>The Mann-Kendall Test for Statistical Significance is used to evaluate the trend<br>over 4 to 10 periods of measure, subject to data availability and comparability.
Age-Adjusted Long Acting or Extended Release Opioid Prescription Rate to Opioid Naive Residents State: California
Age-Adjusted Long Acting or Extended Release Opioid Prescription Rate to Opioid Naive Residents State: California
1.2
Per 100,000 population
(2022)
Compared to:
Prior Value
(1.5)
Prior Value compares a measured value with the previously measured value. Confidence intervals were taken into account in determining the direction of the comparison.
Trend
This comparison measures the indicator’s values over multiple time periods.<br>The Mann-Kendall Test for Statistical Significance is used to evaluate the trend<br>over 4 to 10 periods of measure, subject to data availability and comparability.
Alcohol-Impaired Driving Deaths County: Monterey
Alcohol-Impaired Driving Deaths County: Monterey
38.5%
Percent of driving deaths with alcohol involvement
(2017-2021)
Compared to:
CA Counties
The distribution is based on data from 58 California counties.
U.S. Counties
The distribution is based on data from 3,116 U.S. counties and county equivalents.
CA Value
(26.7%)
The regional value is compared to the California state value.
US Value
(26.3%)
The regional value is compared to the national value.
Prior Value
(37.6%)
Prior Value compares a measured value with the previously measured value. Confidence intervals were taken into account in determining the direction of the comparison.
Trend
This comparison measures the indicator’s values over multiple time periods.<br>The Mann-Kendall Test for Statistical Significance is used to evaluate the trend<br>over 4 to 10 periods of measure, subject to data availability and comparability.
Alcohol-Impaired Driving Deaths State: California
Alcohol-Impaired Driving Deaths State: California
26.7%
Percent of driving deaths with alcohol involvement
(2017-2021)
Compared to:
U.S. States
The distribution is based on data from 50 U.S. states and the District of Columbia.
US Value
(26.3%)
The regional value is compared to the national value.
Prior Value
(27.7%)
Prior Value compares a measured value with the previously measured value. Confidence intervals were taken into account in determining the direction of the comparison.
Trend
This comparison measures the indicator’s values over multiple time periods.<br>The Mann-Kendall Test for Statistical Significance is used to evaluate the trend<br>over 4 to 10 periods of measure, subject to data availability and comparability.
Arrests for Cannabis Possession County: Monterey
Arrests for Cannabis Possession County: Monterey
10
(2020)
Compared to:
Prior Value
(27)
Prior Value compares a measured value with the previously measured value. Confidence intervals were not taken into account in determining the direction of the comparison.
Trend
This comparison measures the indicator’s values over multiple time periods.<br>The Mann-Kendall Test for Statistical Significance is used to evaluate the trend<br>over 4 to 10 periods of measure, subject to data availability and comparability.
Arrests for Cannabis Possession State: California
Arrests for Cannabis Possession State: California
2,711
(2020)
Compared to:
Prior Value
(3,466)
Prior Value compares a measured value with the previously measured value. Confidence intervals were not taken into account in determining the direction of the comparison.
Trend
This comparison measures the indicator’s values over multiple time periods.<br>The Mann-Kendall Test for Statistical Significance is used to evaluate the trend<br>over 4 to 10 periods of measure, subject to data availability and comparability.
Arrests for Drug Sales Offenses: Cannabis County: Monterey
Arrests for Drug Sales Offenses: Cannabis County: Monterey
50
(2016)
Compared to:

Prior Value
(78)
Prior Value compares a measured value with the previously measured value. Confidence intervals were not taken into account in determining the direction of the comparison.
Arrests for Drug Sales Offenses: Cannabis State: California
Arrests for Drug Sales Offenses: Cannabis State: California
1,274
(2020)
Compared to:

Prior Value
(1,419)
Prior Value compares a measured value with the previously measured value. Confidence intervals were not taken into account in determining the direction of the comparison.
Trend
This comparison measures the indicator’s values over multiple time periods.<br>The Mann-Kendall Test for Statistical Significance is used to evaluate the trend<br>over 4 to 10 periods of measure, subject to data availability and comparability.
Cannabis Use in Lifetime by Grade Level County: Monterey
Cannabis Use in Lifetime by Grade Level County: Monterey
54.2%
Percent (%)
(2015-2017)
Compared to:
CA Value
(52.6%)
The regional value is compared to the California state value.
Health / Alcohol & Drug Use
Cannabis Use within 30 days by Parent Education Level
Value
Compared to:
Cannabis Use within 30 days by Parent Education Level County: Monterey
Cannabis Use within 30 days by Parent Education Level County: Monterey
44.5%
Percent (%)
(2015-2017)
Compared to:
CA Value
(45.5%)
The regional value is compared to the California state value.
Cannabis Use within the past 30 days by grade level County: Monterey
Cannabis Use within the past 30 days by grade level County: Monterey
54.2%
Percent (%)
(2015-2017)
Compared to:
CA Value
(27.9%)
The regional value is compared to the California state value.
Health / Alcohol & Drug Use
Cannabis Use within the past 30 days by Race/Ethnicity
Value
Compared to:
Cannabis Use within the past 30 days by Race/Ethnicity County: Monterey
Cannabis Use within the past 30 days by Race/Ethnicity County: Monterey
73.1%
Percent (%)
(2015-2017)
Compared to:
CA Value
(77.5%)
The regional value is compared to the California state value.
Health / Alcohol & Drug Use
Cannabis Use within the past 30 days by Sexual Orientation
Value
Compared to:
Cannabis Use within the past 30 days by Sexual Orientation County: Monterey
Cannabis Use within the past 30 days by Sexual Orientation County: Monterey
37.4%
Percent (%)
(2015-2017)
Compared to:
CA Value
(33.4%)
The regional value is compared to the California state value.
Death Rate due to Drug Poisoning County: Monterey
Death Rate due to Drug Poisoning County: Monterey
20.0
Deaths per 100,000 population
(2019-2021)
Compared to:
CA Counties
The distribution is based on data from 54 California counties.
U.S. Counties
The distribution is based on data from 1,899 U.S. counties and county equivalents.
CA Value
(22.0)
The regional value is compared to the California state value.
US Value
(27.2)
The regional value is compared to the national value.
HP 2030 Target
(20.7)
<div>SU-03: Reduce drug overdose deaths <strong>(LEADING HEALTH INDICATOR)</strong></div>
Death Rate due to Drug Poisoning State: California
Death Rate due to Drug Poisoning State: California
22.0
Deaths per 100,000 population
(2019-2021)
Compared to:
U.S. States
The distribution is based on data from 50 U.S. states and the District of Columbia.
US Value
(27.2)
The regional value is compared to the national value.
HP 2030 Target
(20.7)
<div>SU-03: Reduce drug overdose deaths <strong>(LEADING HEALTH INDICATOR)</strong></div>
Health / Alcohol & Drug Use
Emergency Department visits for Cannabis-related disorders
Value
Compared to:
Emergency Department visits for Cannabis-related disorders County: Monterey
Emergency Department visits for Cannabis-related disorders County: Monterey
493
(2018)
Compared to:
Prior Value
(444)
Prior Value compares a measured value with the previously measured value. Confidence intervals were not taken into account in determining the direction of the comparison.
Health / Alcohol & Drug Use
Emergency Department visits for Cannabis-related disorders Rate per 100,000 population
Value
Compared to:
Emergency Department visits for Cannabis-related disorders Rate per 100,000 population County: Monterey
Emergency Department visits for Cannabis-related disorders Rate per 100,000 population County: Monterey
847.8
Rate per 100,000 population
(2018)
Compared to:
Prior Value
(763.6)
Prior Value compares a measured value with the previously measured value. Confidence intervals were not taken into account in determining the direction of the comparison.
Liquor Store Density County: Monterey
Liquor Store Density County: Monterey
12.1
Stores per 100,000 population
(2021)
Compared to:
CA Counties
The distribution is based on data from 44 California counties.
U.S. Counties
The distribution is based on data from 1,477 U.S. counties and county equivalents.
CA Value
(11.0)
The regional value is compared to the California state value.
US Value
(10.7)
The regional value is compared to the national value.
Prior Value
(10.5)
Prior Value compares a measured value with the previously measured value. Confidence intervals were not taken into account in determining the direction of the comparison.
Trend
This comparison measures the indicator’s values over multiple time periods.<br>The Mann-Kendall Test for Statistical Significance is used to evaluate the trend<br>over 4 to 10 periods of measure, subject to data availability and comparability.
Liquor Store Density State: California
Liquor Store Density State: California
11.0
Stores per 100,000 population
(2021)
Compared to:
U.S. States
The distribution is based on data from 50 U.S. states and the District of Columbia.
US Value
(10.7)
The regional value is compared to the national value.
Prior Value
(10.6)
Prior Value compares a measured value with the previously measured value. Confidence intervals were not taken into account in determining the direction of the comparison.
Trend
This comparison measures the indicator’s values over multiple time periods.<br>The Mann-Kendall Test for Statistical Significance is used to evaluate the trend<br>over 4 to 10 periods of measure, subject to data availability and comparability.
Opioid Prescription Patients County: Monterey
Opioid Prescription Patients County: Monterey
1.6%
(Q3 2022)
Compared to:
CA Counties
The distribution is based on data from 58 California counties.
Prior Value
(1.6%)
Prior Value compares a measured value with the previously measured value. Confidence intervals were not taken into account in determining the direction of the comparison.
Trend
This comparison measures the indicator’s values over multiple time periods.<br>The Mann-Kendall Test for Statistical Significance is used to evaluate the trend<br>over 4 to 10 periods of measure, subject to data availability and comparability.
Opioid Prescription Patients Zip Code: 93426
Opioid Prescription Patients Zip Code: 93426
2.3%
(Q3 2022)
Compared to:
CA Zip Codes
The distribution is based on data from 1,736 California zip codes.
Monterey, CA County Value
(1.6%)
The regional value is compared to the Monterey County value.
Prior Value
(2.4%)
Prior Value compares a measured value with the previously measured value. Confidence intervals were not taken into account in determining the direction of the comparison.
Trend
This comparison measures the indicator’s values over multiple time periods.<br>The Mann-Kendall Test for Statistical Significance is used to evaluate the trend<br>over 4 to 10 periods of measure, subject to data availability and comparability.
Opioid Prescription Patients Zip Code: 93450
Opioid Prescription Patients Zip Code: 93450
1.4%
(Q3 2022)
Compared to:
CA Zip Codes
The distribution is based on data from 1,736 California zip codes.
Monterey, CA County Value
(1.6%)
The regional value is compared to the Monterey County value.
Prior Value
(1.3%)
Prior Value compares a measured value with the previously measured value. Confidence intervals were not taken into account in determining the direction of the comparison.
Trend
This comparison measures the indicator’s values over multiple time periods.<br>The Mann-Kendall Test for Statistical Significance is used to evaluate the trend<br>over 4 to 10 periods of measure, subject to data availability and comparability.
Opioid Prescription Patients Zip Code: 93901
Opioid Prescription Patients Zip Code: 93901
2.3%
(Q3 2022)
Compared to:
CA Zip Codes
The distribution is based on data from 1,736 California zip codes.
Monterey, CA County Value
(1.6%)
The regional value is compared to the Monterey County value.
Prior Value
(2.2%)
Prior Value compares a measured value with the previously measured value. Confidence intervals were not taken into account in determining the direction of the comparison.
Trend
This comparison measures the indicator’s values over multiple time periods.<br>The Mann-Kendall Test for Statistical Significance is used to evaluate the trend<br>over 4 to 10 periods of measure, subject to data availability and comparability.
Opioid Prescription Patients Zip Code: 93905
Opioid Prescription Patients Zip Code: 93905
1.0%
(Q3 2022)
Compared to:
CA Zip Codes
The distribution is based on data from 1,736 California zip codes.
Monterey, CA County Value
(1.6%)
The regional value is compared to the Monterey County value.
Prior Value
(0.9%)
Prior Value compares a measured value with the previously measured value. Confidence intervals were not taken into account in determining the direction of the comparison.
Trend
This comparison measures the indicator’s values over multiple time periods.<br>The Mann-Kendall Test for Statistical Significance is used to evaluate the trend<br>over 4 to 10 periods of measure, subject to data availability and comparability.
Opioid Prescription Patients Zip Code: 93906
Opioid Prescription Patients Zip Code: 93906
1.5%
(Q3 2022)
Compared to:
CA Zip Codes
The distribution is based on data from 1,736 California zip codes.
Monterey, CA County Value
(1.6%)
The regional value is compared to the Monterey County value.
Prior Value
(1.6%)
Prior Value compares a measured value with the previously measured value. Confidence intervals were not taken into account in determining the direction of the comparison.
Trend
This comparison measures the indicator’s values over multiple time periods.<br>The Mann-Kendall Test for Statistical Significance is used to evaluate the trend<br>over 4 to 10 periods of measure, subject to data availability and comparability.
Opioid Prescription Patients Zip Code: 93907
Opioid Prescription Patients Zip Code: 93907
2.1%
(Q3 2022)
Compared to:
CA Zip Codes
The distribution is based on data from 1,736 California zip codes.
Monterey, CA County Value
(1.6%)
The regional value is compared to the Monterey County value.
Prior Value
(2.0%)
Prior Value compares a measured value with the previously measured value. Confidence intervals were not taken into account in determining the direction of the comparison.
Trend
This comparison measures the indicator’s values over multiple time periods.<br>The Mann-Kendall Test for Statistical Significance is used to evaluate the trend<br>over 4 to 10 periods of measure, subject to data availability and comparability.
Opioid Prescription Patients Zip Code: 93908
Opioid Prescription Patients Zip Code: 93908
1.9%
(Q3 2022)
Compared to:
CA Zip Codes
The distribution is based on data from 1,736 California zip codes.
Monterey, CA County Value
(1.6%)
The regional value is compared to the Monterey County value.
Prior Value
(1.8%)
Prior Value compares a measured value with the previously measured value. Confidence intervals were not taken into account in determining the direction of the comparison.
Trend
This comparison measures the indicator’s values over multiple time periods.<br>The Mann-Kendall Test for Statistical Significance is used to evaluate the trend<br>over 4 to 10 periods of measure, subject to data availability and comparability.
Opioid Prescription Patients Zip Code: 93920
Opioid Prescription Patients Zip Code: 93920
1.2%
(Q3 2022)
Compared to:
CA Zip Codes
The distribution is based on data from 1,736 California zip codes.
Monterey, CA County Value
(1.6%)
The regional value is compared to the Monterey County value.
Prior Value
(1.1%)
Prior Value compares a measured value with the previously measured value. Confidence intervals were not taken into account in determining the direction of the comparison.
Trend
This comparison measures the indicator’s values over multiple time periods.<br>The Mann-Kendall Test for Statistical Significance is used to evaluate the trend<br>over 4 to 10 periods of measure, subject to data availability and comparability.
Opioid Prescription Patients Zip Code: 93921
Opioid Prescription Patients Zip Code: 93921
2.5%
(Q3 2022)
Compared to:
CA Zip Codes
The distribution is based on data from 1,736 California zip codes.
Monterey, CA County Value
(1.6%)
The regional value is compared to the Monterey County value.
Prior Value
(2.5%)
Prior Value compares a measured value with the previously measured value. Confidence intervals were not taken into account in determining the direction of the comparison.
Trend
This comparison measures the indicator’s values over multiple time periods.<br>The Mann-Kendall Test for Statistical Significance is used to evaluate the trend<br>over 4 to 10 periods of measure, subject to data availability and comparability.
Opioid Prescription Patients Zip Code: 93923
Opioid Prescription Patients Zip Code: 93923
1.7%
(Q3 2022)
Compared to:
CA Zip Codes
The distribution is based on data from 1,736 California zip codes.
Monterey, CA County Value
(1.6%)
The regional value is compared to the Monterey County value.
Prior Value
(1.8%)
Prior Value compares a measured value with the previously measured value. Confidence intervals were not taken into account in determining the direction of the comparison.
Trend
This comparison measures the indicator’s values over multiple time periods.<br>The Mann-Kendall Test for Statistical Significance is used to evaluate the trend<br>over 4 to 10 periods of measure, subject to data availability and comparability.
Opioid Prescription Patients Zip Code: 93924
Opioid Prescription Patients Zip Code: 93924
2.8%
(Q3 2022)
Compared to:
CA Zip Codes
The distribution is based on data from 1,736 California zip codes.
Monterey, CA County Value
(1.6%)
The regional value is compared to the Monterey County value.
Prior Value
(2.8%)
Prior Value compares a measured value with the previously measured value. Confidence intervals were not taken into account in determining the direction of the comparison.
Trend
This comparison measures the indicator’s values over multiple time periods.<br>The Mann-Kendall Test for Statistical Significance is used to evaluate the trend<br>over 4 to 10 periods of measure, subject to data availability and comparability.
Opioid Prescription Patients Zip Code: 93925
Opioid Prescription Patients Zip Code: 93925
1.3%
(Q3 2022)
Compared to:
CA Zip Codes
The distribution is based on data from 1,736 California zip codes.
Monterey, CA County Value
(1.6%)
The regional value is compared to the Monterey County value.
Prior Value
(1.3%)
Prior Value compares a measured value with the previously measured value. Confidence intervals were not taken into account in determining the direction of the comparison.
Trend
This comparison measures the indicator’s values over multiple time periods.<br>The Mann-Kendall Test for Statistical Significance is used to evaluate the trend<br>over 4 to 10 periods of measure, subject to data availability and comparability.
Opioid Prescription Patients Zip Code: 93926
Opioid Prescription Patients Zip Code: 93926
1.2%
(Q3 2022)
Compared to:
CA Zip Codes
The distribution is based on data from 1,736 California zip codes.
Monterey, CA County Value
(1.6%)
The regional value is compared to the Monterey County value.
Prior Value
(1.3%)
Prior Value compares a measured value with the previously measured value. Confidence intervals were not taken into account in determining the direction of the comparison.
Trend
This comparison measures the indicator’s values over multiple time periods.<br>The Mann-Kendall Test for Statistical Significance is used to evaluate the trend<br>over 4 to 10 periods of measure, subject to data availability and comparability.
Opioid Prescription Patients Zip Code: 93927
Opioid Prescription Patients Zip Code: 93927
1.1%
(Q3 2022)
Compared to:
CA Zip Codes
The distribution is based on data from 1,736 California zip codes.
Monterey, CA County Value
(1.6%)
The regional value is compared to the Monterey County value.
Prior Value
(1.2%)
Prior Value compares a measured value with the previously measured value. Confidence intervals were not taken into account in determining the direction of the comparison.
Trend
This comparison measures the indicator’s values over multiple time periods.<br>The Mann-Kendall Test for Statistical Significance is used to evaluate the trend<br>over 4 to 10 periods of measure, subject to data availability and comparability.
Opioid Prescription Patients Zip Code: 93928
Opioid Prescription Patients Zip Code: 93928
0.9%
(Q3 2022)
Compared to:
CA Zip Codes
The distribution is based on data from 1,736 California zip codes.
Monterey, CA County Value
(1.6%)
The regional value is compared to the Monterey County value.
Prior Value
(0.8%)
Prior Value compares a measured value with the previously measured value. Confidence intervals were not taken into account in determining the direction of the comparison.
Trend
This comparison measures the indicator’s values over multiple time periods.<br>The Mann-Kendall Test for Statistical Significance is used to evaluate the trend<br>over 4 to 10 periods of measure, subject to data availability and comparability.
Opioid Prescription Patients Zip Code: 93930
Opioid Prescription Patients Zip Code: 93930
1.3%
(Q3 2022)
Compared to:
CA Zip Codes
The distribution is based on data from 1,736 California zip codes.
Monterey, CA County Value
(1.6%)
The regional value is compared to the Monterey County value.
Prior Value
(1.2%)
Prior Value compares a measured value with the previously measured value. Confidence intervals were not taken into account in determining the direction of the comparison.
Trend
This comparison measures the indicator’s values over multiple time periods.<br>The Mann-Kendall Test for Statistical Significance is used to evaluate the trend<br>over 4 to 10 periods of measure, subject to data availability and comparability.
Opioid Prescription Patients Zip Code: 93932
Opioid Prescription Patients Zip Code: 93932
2.4%
(Q3 2022)
Compared to:
CA Zip Codes
The distribution is based on data from 1,736 California zip codes.
Monterey, CA County Value
(1.6%)
The regional value is compared to the Monterey County value.
Prior Value
(2.4%)
Prior Value compares a measured value with the previously measured value. Confidence intervals were not taken into account in determining the direction of the comparison.
Trend
This comparison measures the indicator’s values over multiple time periods.<br>The Mann-Kendall Test for Statistical Significance is used to evaluate the trend<br>over 4 to 10 periods of measure, subject to data availability and comparability.
Opioid Prescription Patients Zip Code: 93933
Opioid Prescription Patients Zip Code: 93933
1.9%
(Q3 2022)
Compared to:
CA Zip Codes
The distribution is based on data from 1,736 California zip codes.
Monterey, CA County Value
(1.6%)
The regional value is compared to the Monterey County value.
Prior Value
(1.8%)
Prior Value compares a measured value with the previously measured value. Confidence intervals were not taken into account in determining the direction of the comparison.
Trend
This comparison measures the indicator’s values over multiple time periods.<br>The Mann-Kendall Test for Statistical Significance is used to evaluate the trend<br>over 4 to 10 periods of measure, subject to data availability and comparability.
Opioid Prescription Patients Zip Code: 93940
Opioid Prescription Patients Zip Code: 93940
2.0%
(Q3 2022)
Compared to:
CA Zip Codes
The distribution is based on data from 1,736 California zip codes.
Monterey, CA County Value
(1.6%)
The regional value is compared to the Monterey County value.
Prior Value
(2.0%)
Prior Value compares a measured value with the previously measured value. Confidence intervals were not taken into account in determining the direction of the comparison.
Trend
This comparison measures the indicator’s values over multiple time periods.<br>The Mann-Kendall Test for Statistical Significance is used to evaluate the trend<br>over 4 to 10 periods of measure, subject to data availability and comparability.
Opioid Prescription Patients Zip Code: 93943
Opioid Prescription Patients Zip Code: 93943
16.7%
(Q4 2021)
Compared to:
CA Zip Codes
The distribution is based on data from 1,752 California zip codes.
Monterey, CA County Value
(1.8%)
The regional value is compared to the Monterey County value.
Prior Value
(16.7%)
Prior Value compares a measured value with the previously measured value. Confidence intervals were not taken into account in determining the direction of the comparison.
Trend
This comparison measures the indicator’s values over multiple time periods.<br>The Mann-Kendall Test for Statistical Significance is used to evaluate the trend<br>over 4 to 10 periods of measure, subject to data availability and comparability.
Opioid Prescription Patients Zip Code: 93950
Opioid Prescription Patients Zip Code: 93950
2.1%
(Q3 2022)
Compared to:
CA Zip Codes
The distribution is based on data from 1,736 California zip codes.
Monterey, CA County Value
(1.6%)
The regional value is compared to the Monterey County value.
Prior Value
(2.1%)
Prior Value compares a measured value with the previously measured value. Confidence intervals were not taken into account in determining the direction of the comparison.
Trend
This comparison measures the indicator’s values over multiple time periods.<br>The Mann-Kendall Test for Statistical Significance is used to evaluate the trend<br>over 4 to 10 periods of measure, subject to data availability and comparability.
Opioid Prescription Patients Zip Code: 93953
Opioid Prescription Patients Zip Code: 93953
2.4%
(Q3 2022)
Compared to:
CA Zip Codes
The distribution is based on data from 1,736 California zip codes.
Monterey, CA County Value
(1.6%)
The regional value is compared to the Monterey County value.
Prior Value
(2.4%)
Prior Value compares a measured value with the previously measured value. Confidence intervals were not taken into account in determining the direction of the comparison.
Trend
This comparison measures the indicator’s values over multiple time periods.<br>The Mann-Kendall Test for Statistical Significance is used to evaluate the trend<br>over 4 to 10 periods of measure, subject to data availability and comparability.
Opioid Prescription Patients Zip Code: 93954
Opioid Prescription Patients Zip Code: 93954
1.5%
(Q3 2022)
Compared to:
CA Zip Codes
The distribution is based on data from 1,736 California zip codes.
Monterey, CA County Value
(1.6%)
The regional value is compared to the Monterey County value.
Prior Value
(0.8%)
Prior Value compares a measured value with the previously measured value. Confidence intervals were not taken into account in determining the direction of the comparison.
Trend
This comparison measures the indicator’s values over multiple time periods.<br>The Mann-Kendall Test for Statistical Significance is used to evaluate the trend<br>over 4 to 10 periods of measure, subject to data availability and comparability.
Opioid Prescription Patients Zip Code: 93955
Opioid Prescription Patients Zip Code: 93955
1.6%
(Q3 2022)
Compared to:
CA Zip Codes
The distribution is based on data from 1,736 California zip codes.
Monterey, CA County Value
(1.6%)
The regional value is compared to the Monterey County value.
Prior Value
(1.7%)
Prior Value compares a measured value with the previously measured value. Confidence intervals were not taken into account in determining the direction of the comparison.
Trend
This comparison measures the indicator’s values over multiple time periods.<br>The Mann-Kendall Test for Statistical Significance is used to evaluate the trend<br>over 4 to 10 periods of measure, subject to data availability and comparability.
Opioid Prescription Patients Zip Code: 93960
Opioid Prescription Patients Zip Code: 93960
1.1%
(Q3 2022)
Compared to:
CA Zip Codes
The distribution is based on data from 1,736 California zip codes.
Monterey, CA County Value
(1.6%)
The regional value is compared to the Monterey County value.
Prior Value
(1.0%)
Prior Value compares a measured value with the previously measured value. Confidence intervals were not taken into account in determining the direction of the comparison.
Trend
This comparison measures the indicator’s values over multiple time periods.<br>The Mann-Kendall Test for Statistical Significance is used to evaluate the trend<br>over 4 to 10 periods of measure, subject to data availability and comparability.
Opioid Prescription Patients Zip Code: 93962
Opioid Prescription Patients Zip Code: 93962
3.6%
(Q3 2022)
Compared to:
CA Zip Codes
The distribution is based on data from 1,736 California zip codes.
Monterey, CA County Value
(1.6%)
The regional value is compared to the Monterey County value.
Prior Value
(3.4%)
Prior Value compares a measured value with the previously measured value. Confidence intervals were not taken into account in determining the direction of the comparison.
Trend
This comparison measures the indicator’s values over multiple time periods.<br>The Mann-Kendall Test for Statistical Significance is used to evaluate the trend<br>over 4 to 10 periods of measure, subject to data availability and comparability.
Opioid Prescription Patients Zip Code: 95004
Opioid Prescription Patients Zip Code: 95004
2.0%
(Q3 2022)
Compared to:
CA Zip Codes
The distribution is based on data from 1,736 California zip codes.
Monterey, CA County Value
(1.6%)
The regional value is compared to the Monterey County value.
Prior Value
(1.9%)
Prior Value compares a measured value with the previously measured value. Confidence intervals were not taken into account in determining the direction of the comparison.
Trend
This comparison measures the indicator’s values over multiple time periods.<br>The Mann-Kendall Test for Statistical Significance is used to evaluate the trend<br>over 4 to 10 periods of measure, subject to data availability and comparability.
Opioid Prescription Patients Zip Code: 95012
Opioid Prescription Patients Zip Code: 95012
1.5%
(Q3 2022)
Compared to:
CA Zip Codes
The distribution is based on data from 1,736 California zip codes.
Monterey, CA County Value
(1.6%)
The regional value is compared to the Monterey County value.
Prior Value
(1.5%)
Prior Value compares a measured value with the previously measured value. Confidence intervals were not taken into account in determining the direction of the comparison.
Trend
This comparison measures the indicator’s values over multiple time periods.<br>The Mann-Kendall Test for Statistical Significance is used to evaluate the trend<br>over 4 to 10 periods of measure, subject to data availability and comparability.
Opioid Prescription Patients Zip Code: 95039
Opioid Prescription Patients Zip Code: 95039
2.5%
(Q3 2022)
Compared to:
CA Zip Codes
The distribution is based on data from 1,736 California zip codes.
Monterey, CA County Value
(1.6%)
The regional value is compared to the Monterey County value.
Prior Value
(2.8%)
Prior Value compares a measured value with the previously measured value. Confidence intervals were not taken into account in determining the direction of the comparison.
Trend
This comparison measures the indicator’s values over multiple time periods.<br>The Mann-Kendall Test for Statistical Significance is used to evaluate the trend<br>over 4 to 10 periods of measure, subject to data availability and comparability.
Opioid Prescription Patients Zip Code: 95076
Opioid Prescription Patients Zip Code: 95076
1.8%
(Q3 2022)
Compared to:
CA Zip Codes
The distribution is based on data from 1,736 California zip codes.
Santa Cruz, CA County Value
(2.0%)
The regional value is compared to the Santa Cruz County value.
Monterey, CA County Value
(1.6%)
The regional value is compared to the Monterey County value.
Prior Value
(1.7%)
Prior Value compares a measured value with the previously measured value. Confidence intervals were not taken into account in determining the direction of the comparison.
Trend
This comparison measures the indicator’s values over multiple time periods.<br>The Mann-Kendall Test for Statistical Significance is used to evaluate the trend<br>over 4 to 10 periods of measure, subject to data availability and comparability.
Quarterly Opioid Prescription Rate County: Monterey
Quarterly Opioid Prescription Rate County: Monterey
219.7
Prescriptions per 10,000 population
(Q3 2022)
Compared to:
CA Counties
The distribution is based on data from 58 California counties.
Prior Value
(211.5)
Prior Value compares a measured value with the previously measured value. Confidence intervals were not taken into account in determining the direction of the comparison.
Trend
This comparison measures the indicator’s values over multiple time periods.<br>The Mann-Kendall Test for Statistical Significance is used to evaluate the trend<br>over 4 to 10 periods of measure, subject to data availability and comparability.
Quarterly Opioid Prescription Rate Zip Code: 93426
Quarterly Opioid Prescription Rate Zip Code: 93426
276.4
Prescriptions per 10,000 population
(Q2 2022)
Compared to:
CA Zip Codes
The distribution is based on data from 2,177 California zip codes.
Monterey, CA County Value
(211.5)
The regional value is compared to the Monterey County value.
Prior Value
(238.1)
Prior Value compares a measured value with the previously measured value. Confidence intervals were not taken into account in determining the direction of the comparison.
Trend
This comparison measures the indicator’s values over multiple time periods.<br>The Mann-Kendall Test for Statistical Significance is used to evaluate the trend<br>over 4 to 10 periods of measure, subject to data availability and comparability.
Quarterly Opioid Prescription Rate Zip Code: 93450
Quarterly Opioid Prescription Rate Zip Code: 93450
395.7
Prescriptions per 10,000 population
(Q3 2022)
Compared to:
CA Zip Codes
The distribution is based on data from 1,732 California zip codes.
Monterey, CA County Value
(219.7)
The regional value is compared to the Monterey County value.
Prior Value
(160.8)
Prior Value compares a measured value with the previously measured value. Confidence intervals were not taken into account in determining the direction of the comparison.
Trend
This comparison measures the indicator’s values over multiple time periods.<br>The Mann-Kendall Test for Statistical Significance is used to evaluate the trend<br>over 4 to 10 periods of measure, subject to data availability and comparability.
Quarterly Opioid Prescription Rate Zip Code: 93901
Quarterly Opioid Prescription Rate Zip Code: 93901
297.2
Prescriptions per 10,000 population
(Q2 2022)
Compared to:
CA Zip Codes
The distribution is based on data from 2,177 California zip codes.
Monterey, CA County Value
(211.5)
The regional value is compared to the Monterey County value.
Prior Value
(300.4)
Prior Value compares a measured value with the previously measured value. Confidence intervals were not taken into account in determining the direction of the comparison.
Trend
This comparison measures the indicator’s values over multiple time periods.<br>The Mann-Kendall Test for Statistical Significance is used to evaluate the trend<br>over 4 to 10 periods of measure, subject to data availability and comparability.
Quarterly Opioid Prescription Rate Zip Code: 93905
Quarterly Opioid Prescription Rate Zip Code: 93905
109.8
Prescriptions per 10,000 population
(Q2 2022)
Compared to:
CA Zip Codes
The distribution is based on data from 2,177 California zip codes.
Monterey, CA County Value
(211.5)
The regional value is compared to the Monterey County value.
Prior Value
(106.1)
Prior Value compares a measured value with the previously measured value. Confidence intervals were not taken into account in determining the direction of the comparison.
Trend
This comparison measures the indicator’s values over multiple time periods.<br>The Mann-Kendall Test for Statistical Significance is used to evaluate the trend<br>over 4 to 10 periods of measure, subject to data availability and comparability.
Quarterly Opioid Prescription Rate Zip Code: 93906
Quarterly Opioid Prescription Rate Zip Code: 93906
183.0
Prescriptions per 10,000 population
(Q2 2022)
Compared to:
CA Zip Codes
The distribution is based on data from 2,177 California zip codes.
Monterey, CA County Value
(211.5)
The regional value is compared to the Monterey County value.
Prior Value
(179.9)
Prior Value compares a measured value with the previously measured value. Confidence intervals were not taken into account in determining the direction of the comparison.
Trend
This comparison measures the indicator’s values over multiple time periods.<br>The Mann-Kendall Test for Statistical Significance is used to evaluate the trend<br>over 4 to 10 periods of measure, subject to data availability and comparability.
Quarterly Opioid Prescription Rate Zip Code: 93907
Quarterly Opioid Prescription Rate Zip Code: 93907
238.6
Prescriptions per 10,000 population
(Q2 2022)
Compared to:
CA Zip Codes
The distribution is based on data from 2,177 California zip codes.
Monterey, CA County Value
(211.5)
The regional value is compared to the Monterey County value.
Prior Value
(231.2)
Prior Value compares a measured value with the previously measured value. Confidence intervals were not taken into account in determining the direction of the comparison.
Trend
This comparison measures the indicator’s values over multiple time periods.<br>The Mann-Kendall Test for Statistical Significance is used to evaluate the trend<br>over 4 to 10 periods of measure, subject to data availability and comparability.
Quarterly Opioid Prescription Rate Zip Code: 93908
Quarterly Opioid Prescription Rate Zip Code: 93908
226.4
Prescriptions per 10,000 population
(Q2 2022)
Compared to:
CA Zip Codes
The distribution is based on data from 2,177 California zip codes.
Monterey, CA County Value
(211.5)
The regional value is compared to the Monterey County value.
Prior Value
(240.4)
Prior Value compares a measured value with the previously measured value. Confidence intervals were not taken into account in determining the direction of the comparison.
Trend
This comparison measures the indicator’s values over multiple time periods.<br>The Mann-Kendall Test for Statistical Significance is used to evaluate the trend<br>over 4 to 10 periods of measure, subject to data availability and comparability.
Quarterly Opioid Prescription Rate Zip Code: 93915
Quarterly Opioid Prescription Rate Zip Code: 93915
297.2
Prescriptions per 10,000 population
(Q2 2022)
Compared to:
CA Zip Codes
The distribution is based on data from 2,177 California zip codes.
Monterey, CA County Value
(211.5)
The regional value is compared to the Monterey County value.
Prior Value
(297.2)
Prior Value compares a measured value with the previously measured value. Confidence intervals were not taken into account in determining the direction of the comparison.
Quarterly Opioid Prescription Rate Zip Code: 93920
Quarterly Opioid Prescription Rate Zip Code: 93920
129.4
Prescriptions per 10,000 population
(Q2 2022)
Compared to:
CA Zip Codes
The distribution is based on data from 2,177 California zip codes.
Monterey, CA County Value
(211.5)
The regional value is compared to the Monterey County value.
Prior Value
(125.1)
Prior Value compares a measured value with the previously measured value. Confidence intervals were not taken into account in determining the direction of the comparison.
Trend
This comparison measures the indicator’s values over multiple time periods.<br>The Mann-Kendall Test for Statistical Significance is used to evaluate the trend<br>over 4 to 10 periods of measure, subject to data availability and comparability.
Quarterly Opioid Prescription Rate Zip Code: 93921
Quarterly Opioid Prescription Rate Zip Code: 93921
334.7
Prescriptions per 10,000 population
(Q2 2022)
Compared to:
CA Zip Codes
The distribution is based on data from 2,177 California zip codes.
Monterey, CA County Value
(211.5)
The regional value is compared to the Monterey County value.
Prior Value
(326.7)
Prior Value compares a measured value with the previously measured value. Confidence intervals were not taken into account in determining the direction of the comparison.
Trend
This comparison measures the indicator’s values over multiple time periods.<br>The Mann-Kendall Test for Statistical Significance is used to evaluate the trend<br>over 4 to 10 periods of measure, subject to data availability and comparability.
Quarterly Opioid Prescription Rate Zip Code: 93922
Quarterly Opioid Prescription Rate Zip Code: 93922
183.0
Prescriptions per 10,000 population
(Q2 2022)
Compared to:
CA Zip Codes
The distribution is based on data from 2,177 California zip codes.
Monterey, CA County Value
(211.5)
The regional value is compared to the Monterey County value.
Prior Value
(183.0)
Prior Value compares a measured value with the previously measured value. Confidence intervals were not taken into account in determining the direction of the comparison.
Quarterly Opioid Prescription Rate Zip Code: 93923
Quarterly Opioid Prescription Rate Zip Code: 93923
231.4
Prescriptions per 10,000 population
(Q2 2022)
Compared to:
CA Zip Codes
The distribution is based on data from 2,177 California zip codes.
Monterey, CA County Value
(211.5)
The regional value is compared to the Monterey County value.
Prior Value
(250.8)
Prior Value compares a measured value with the previously measured value. Confidence intervals were not taken into account in determining the direction of the comparison.
Trend
This comparison measures the indicator’s values over multiple time periods.<br>The Mann-Kendall Test for Statistical Significance is used to evaluate the trend<br>over 4 to 10 periods of measure, subject to data availability and comparability.
Quarterly Opioid Prescription Rate Zip Code: 93924
Quarterly Opioid Prescription Rate Zip Code: 93924
359.2
Prescriptions per 10,000 population
(Q2 2022)
Compared to:
CA Zip Codes
The distribution is based on data from 2,177 California zip codes.
Monterey, CA County Value
(211.5)
The regional value is compared to the Monterey County value.
Prior Value
(335.7)
Prior Value compares a measured value with the previously measured value. Confidence intervals were not taken into account in determining the direction of the comparison.
Trend
This comparison measures the indicator’s values over multiple time periods.<br>The Mann-Kendall Test for Statistical Significance is used to evaluate the trend<br>over 4 to 10 periods of measure, subject to data availability and comparability.
Quarterly Opioid Prescription Rate Zip Code: 93925
Quarterly Opioid Prescription Rate Zip Code: 93925
159.2
Prescriptions per 10,000 population
(Q2 2022)
Compared to:
CA Zip Codes
The distribution is based on data from 2,177 California zip codes.
Monterey, CA County Value
(211.5)
The regional value is compared to the Monterey County value.
Prior Value
(115.8)
Prior Value compares a measured value with the previously measured value. Confidence intervals were not taken into account in determining the direction of the comparison.
Trend
This comparison measures the indicator’s values over multiple time periods.<br>The Mann-Kendall Test for Statistical Significance is used to evaluate the trend<br>over 4 to 10 periods of measure, subject to data availability and comparability.
Quarterly Opioid Prescription Rate Zip Code: 93926
Quarterly Opioid Prescription Rate Zip Code: 93926
150.5
Prescriptions per 10,000 population
(Q2 2022)
Compared to:
CA Zip Codes
The distribution is based on data from 2,177 California zip codes.
Monterey, CA County Value
(211.5)
The regional value is compared to the Monterey County value.
Prior Value
(141.0)
Prior Value compares a measured value with the previously measured value. Confidence intervals were not taken into account in determining the direction of the comparison.
Trend
This comparison measures the indicator’s values over multiple time periods.<br>The Mann-Kendall Test for Statistical Significance is used to evaluate the trend<br>over 4 to 10 periods of measure, subject to data availability and comparability.
Quarterly Opioid Prescription Rate Zip Code: 93927
Quarterly Opioid Prescription Rate Zip Code: 93927
138.7
Prescriptions per 10,000 population
(Q2 2022)
Compared to:
CA Zip Codes
The distribution is based on data from 2,177 California zip codes.
Monterey, CA County Value
(211.5)
The regional value is compared to the Monterey County value.
Prior Value
(135.4)
Prior Value compares a measured value with the previously measured value. Confidence intervals were not taken into account in determining the direction of the comparison.
Trend
This comparison measures the indicator’s values over multiple time periods.<br>The Mann-Kendall Test for Statistical Significance is used to evaluate the trend<br>over 4 to 10 periods of measure, subject to data availability and comparability.
Quarterly Opioid Prescription Rate Zip Code: 93928
Quarterly Opioid Prescription Rate Zip Code: 93928
93.7
Prescriptions per 10,000 population
(Q2 2022)
Compared to:
CA Zip Codes
The distribution is based on data from 2,177 California zip codes.
Monterey, CA County Value
(211.5)
The regional value is compared to the Monterey County value.
Prior Value
(78.1)
Prior Value compares a measured value with the previously measured value. Confidence intervals were not taken into account in determining the direction of the comparison.
Trend
This comparison measures the indicator’s values over multiple time periods.<br>The Mann-Kendall Test for Statistical Significance is used to evaluate the trend<br>over 4 to 10 periods of measure, subject to data availability and comparability.
Quarterly Opioid Prescription Rate Zip Code: 93930
Quarterly Opioid Prescription Rate Zip Code: 93930
138.7
Prescriptions per 10,000 population
(Q2 2022)
Compared to:
CA Zip Codes
The distribution is based on data from 2,177 California zip codes.
Monterey, CA County Value
(211.5)
The regional value is compared to the Monterey County value.
Prior Value
(146.5)
Prior Value compares a measured value with the previously measured value. Confidence intervals were not taken into account in determining the direction of the comparison.
Trend
This comparison measures the indicator’s values over multiple time periods.<br>The Mann-Kendall Test for Statistical Significance is used to evaluate the trend<br>over 4 to 10 periods of measure, subject to data availability and comparability.
Quarterly Opioid Prescription Rate Zip Code: 93932
Quarterly Opioid Prescription Rate Zip Code: 93932
334.7
Prescriptions per 10,000 population
(Q3 2022)
Compared to:
CA Zip Codes
The distribution is based on data from 1,732 California zip codes.
Monterey, CA County Value
(219.7)
The regional value is compared to the Monterey County value.
Prior Value
(286.8)
Prior Value compares a measured value with the previously measured value. Confidence intervals were not taken into account in determining the direction of the comparison.
Trend
This comparison measures the indicator’s values over multiple time periods.<br>The Mann-Kendall Test for Statistical Significance is used to evaluate the trend<br>over 4 to 10 periods of measure, subject to data availability and comparability.
Quarterly Opioid Prescription Rate Zip Code: 93933
Quarterly Opioid Prescription Rate Zip Code: 93933
226.8
Prescriptions per 10,000 population
(Q2 2022)
Compared to:
CA Zip Codes
The distribution is based on data from 2,177 California zip codes.
Monterey, CA County Value
(211.5)
The regional value is compared to the Monterey County value.
Prior Value
(230.5)
Prior Value compares a measured value with the previously measured value. Confidence intervals were not taken into account in determining the direction of the comparison.
Trend
This comparison measures the indicator’s values over multiple time periods.<br>The Mann-Kendall Test for Statistical Significance is used to evaluate the trend<br>over 4 to 10 periods of measure, subject to data availability and comparability.
Quarterly Opioid Prescription Rate Zip Code: 93940
Quarterly Opioid Prescription Rate Zip Code: 93940
112.7
Prescriptions per 10,000 population
(Q3 2022)
Compared to:
CA Zip Codes
The distribution is based on data from 1,732 California zip codes.
Monterey, CA County Value
(219.7)
The regional value is compared to the Monterey County value.
Prior Value
(389.4)
Prior Value compares a measured value with the previously measured value. Confidence intervals were not taken into account in determining the direction of the comparison.
Trend
This comparison measures the indicator’s values over multiple time periods.<br>The Mann-Kendall Test for Statistical Significance is used to evaluate the trend<br>over 4 to 10 periods of measure, subject to data availability and comparability.
Quarterly Opioid Prescription Rate Zip Code: 93942
Quarterly Opioid Prescription Rate Zip Code: 93942
184.1
Prescriptions per 10,000 population
(Q3 2022)
Compared to:
CA Zip Codes
The distribution is based on data from 1,732 California zip codes.
Monterey, CA County Value
(219.7)
The regional value is compared to the Monterey County value.
Prior Value
(150.5)
Prior Value compares a measured value with the previously measured value. Confidence intervals were not taken into account in determining the direction of the comparison.
Quarterly Opioid Prescription Rate Zip Code: 93943
Quarterly Opioid Prescription Rate Zip Code: 93943
249.7
Prescriptions per 10,000 population
(Q3 2022)
Compared to:
CA Zip Codes
The distribution is based on data from 1,732 California zip codes.
Monterey, CA County Value
(219.7)
The regional value is compared to the Monterey County value.
Prior Value
(138.7)
Prior Value compares a measured value with the previously measured value. Confidence intervals were not taken into account in determining the direction of the comparison.
Trend
This comparison measures the indicator’s values over multiple time periods.<br>The Mann-Kendall Test for Statistical Significance is used to evaluate the trend<br>over 4 to 10 periods of measure, subject to data availability and comparability.
Quarterly Opioid Prescription Rate Zip Code: 93944
Quarterly Opioid Prescription Rate Zip Code: 93944
242.2
Prescriptions per 10,000 population
(Q3 2022)
Compared to:
CA Zip Codes
The distribution is based on data from 1,732 California zip codes.
Monterey, CA County Value
(219.7)
The regional value is compared to the Monterey County value.
Prior Value
(93.7)
Prior Value compares a measured value with the previously measured value. Confidence intervals were not taken into account in determining the direction of the comparison.
Quarterly Opioid Prescription Rate Zip Code: 93950
Quarterly Opioid Prescription Rate Zip Code: 93950
284.7
Prescriptions per 10,000 population
(Q2 2022)
Compared to:
CA Zip Codes
The distribution is based on data from 2,177 California zip codes.
Monterey, CA County Value
(211.5)
The regional value is compared to the Monterey County value.
Prior Value
(271.0)
Prior Value compares a measured value with the previously measured value. Confidence intervals were not taken into account in determining the direction of the comparison.
Trend
This comparison measures the indicator’s values over multiple time periods.<br>The Mann-Kendall Test for Statistical Significance is used to evaluate the trend<br>over 4 to 10 periods of measure, subject to data availability and comparability.
Quarterly Opioid Prescription Rate Zip Code: 93953
Quarterly Opioid Prescription Rate Zip Code: 93953
314.5
Prescriptions per 10,000 population
(Q2 2022)
Compared to:
CA Zip Codes
The distribution is based on data from 2,177 California zip codes.
Monterey, CA County Value
(211.5)
The regional value is compared to the Monterey County value.
Prior Value
(321.1)
Prior Value compares a measured value with the previously measured value. Confidence intervals were not taken into account in determining the direction of the comparison.
Trend
This comparison measures the indicator’s values over multiple time periods.<br>The Mann-Kendall Test for Statistical Significance is used to evaluate the trend<br>over 4 to 10 periods of measure, subject to data availability and comparability.
Quarterly Opioid Prescription Rate Zip Code: 93954
Quarterly Opioid Prescription Rate Zip Code: 93954
146.7
Prescriptions per 10,000 population
(Q3 2022)
Compared to:
CA Zip Codes
The distribution is based on data from 1,732 California zip codes.
Monterey, CA County Value
(219.7)
The regional value is compared to the Monterey County value.
Prior Value
(90.7)
Prior Value compares a measured value with the previously measured value. Confidence intervals were not taken into account in determining the direction of the comparison.
Trend
This comparison measures the indicator’s values over multiple time periods.<br>The Mann-Kendall Test for Statistical Significance is used to evaluate the trend<br>over 4 to 10 periods of measure, subject to data availability and comparability.
Quarterly Opioid Prescription Rate Zip Code: 93955
Quarterly Opioid Prescription Rate Zip Code: 93955
330.7
Prescriptions per 10,000 population
(Q3 2022)
Compared to:
CA Zip Codes
The distribution is based on data from 1,732 California zip codes.
Monterey, CA County Value
(219.7)
The regional value is compared to the Monterey County value.
Prior Value
(213.6)
Prior Value compares a measured value with the previously measured value. Confidence intervals were not taken into account in determining the direction of the comparison.
Trend
This comparison measures the indicator’s values over multiple time periods.<br>The Mann-Kendall Test for Statistical Significance is used to evaluate the trend<br>over 4 to 10 periods of measure, subject to data availability and comparability.
Quarterly Opioid Prescription Rate Zip Code: 93960
Quarterly Opioid Prescription Rate Zip Code: 93960
115.9
Prescriptions per 10,000 population
(Q2 2022)
Compared to:
CA Zip Codes
The distribution is based on data from 2,177 California zip codes.
Monterey, CA County Value
(211.5)
The regional value is compared to the Monterey County value.
Prior Value
(116.7)
Prior Value compares a measured value with the previously measured value. Confidence intervals were not taken into account in determining the direction of the comparison.
Trend
This comparison measures the indicator’s values over multiple time periods.<br>The Mann-Kendall Test for Statistical Significance is used to evaluate the trend<br>over 4 to 10 periods of measure, subject to data availability and comparability.
Quarterly Opioid Prescription Rate Zip Code: 93962
Quarterly Opioid Prescription Rate Zip Code: 93962
229.5
Prescriptions per 10,000 population
(Q3 2022)
Compared to:
CA Zip Codes
The distribution is based on data from 1,732 California zip codes.
Monterey, CA County Value
(219.7)
The regional value is compared to the Monterey County value.
Prior Value
(386.5)
Prior Value compares a measured value with the previously measured value. Confidence intervals were not taken into account in determining the direction of the comparison.
Trend
This comparison measures the indicator’s values over multiple time periods.<br>The Mann-Kendall Test for Statistical Significance is used to evaluate the trend<br>over 4 to 10 periods of measure, subject to data availability and comparability.
Quarterly Opioid Prescription Rate Zip Code: 95004
Quarterly Opioid Prescription Rate Zip Code: 95004
411.0
Prescriptions per 10,000 population
(Q3 2022)
Compared to:
CA Zip Codes
The distribution is based on data from 1,732 California zip codes.
Monterey, CA County Value
(219.7)
The regional value is compared to the Monterey County value.
Prior Value
(230.0)
Prior Value compares a measured value with the previously measured value. Confidence intervals were not taken into account in determining the direction of the comparison.
Trend
This comparison measures the indicator’s values over multiple time periods.<br>The Mann-Kendall Test for Statistical Significance is used to evaluate the trend<br>over 4 to 10 periods of measure, subject to data availability and comparability.
Quarterly Opioid Prescription Rate Zip Code: 95012
Quarterly Opioid Prescription Rate Zip Code: 95012
174.1
Prescriptions per 10,000 population
(Q2 2022)
Compared to:
CA Zip Codes
The distribution is based on data from 2,177 California zip codes.
Monterey, CA County Value
(211.5)
The regional value is compared to the Monterey County value.
Prior Value
(175.6)
Prior Value compares a measured value with the previously measured value. Confidence intervals were not taken into account in determining the direction of the comparison.
Trend
This comparison measures the indicator’s values over multiple time periods.<br>The Mann-Kendall Test for Statistical Significance is used to evaluate the trend<br>over 4 to 10 periods of measure, subject to data availability and comparability.
Quarterly Opioid Prescription Rate Zip Code: 95039
Quarterly Opioid Prescription Rate Zip Code: 95039
187.9
Prescriptions per 10,000 population
(Q3 2022)
Compared to:
CA Zip Codes
The distribution is based on data from 1,732 California zip codes.
Monterey, CA County Value
(219.7)
The regional value is compared to the Monterey County value.
Prior Value
(344.5)
Prior Value compares a measured value with the previously measured value. Confidence intervals were not taken into account in determining the direction of the comparison.
Trend
This comparison measures the indicator’s values over multiple time periods.<br>The Mann-Kendall Test for Statistical Significance is used to evaluate the trend<br>over 4 to 10 periods of measure, subject to data availability and comparability.
Quarterly Opioid Prescription Rate Zip Code: 95076
Quarterly Opioid Prescription Rate Zip Code: 95076
208.5
Prescriptions per 10,000 population
(Q2 2022)
Compared to:
CA Zip Codes
The distribution is based on data from 2,177 California zip codes.
Santa Cruz, CA County Value
(255.3)
The regional value is compared to the Santa Cruz County value.
Monterey, CA County Value
(211.5)
The regional value is compared to the Monterey County value.
Prior Value
(201.3)
Prior Value compares a measured value with the previously measured value. Confidence intervals were not taken into account in determining the direction of the comparison.
Trend
This comparison measures the indicator’s values over multiple time periods.<br>The Mann-Kendall Test for Statistical Significance is used to evaluate the trend<br>over 4 to 10 periods of measure, subject to data availability and comparability.
